
The Bahrain new light vehicle market is up 8.7% year-on-year over the first 9 months of 2021 to 18,363 registrations. Brand leader Toyota (-2.1%) can’t quite jump on the positive bandwagon but remains ultra-dominant at 38% share. Nissan (+33.9%) impresses and sees its share climb to 10.6%, distancing Lexus (+4.2%) at 7.2% of the market. Isuzu (+41.6%) and MG (+25.7%) also excel in the remainder of the Top 10 while Mazda (+9.1%) matches the market growth and Kia (+4.7%), Honda (+3.4%) and Hyundai (+1%) are shy. Mitsubishi (-17.4%) struggles and falls to #10. Further down, notice Haval up to #14 and Genesis (+234.6%), Hino (+96.6%), Infiniti (+56%), Cadillac (+55.8%), Ford (+53.3%), Changan (+45.5%) and Jeep (+28.9%) all posting fantastic gains.
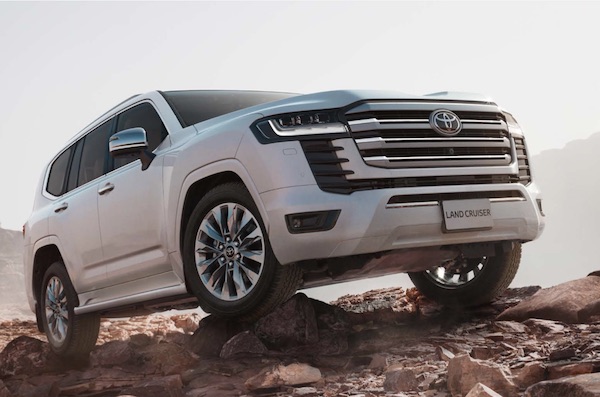
Over in the models ranking, the Toyota Land Cruiser (+8.8%) follows the market to a splendid 11.3% share, with the Nissan Sunny (+69.7%) and Isuzu TF (+51.4%) extremely dynamic below. The Toyota Corolla (+8.9%) and Hiace (+37.1%) round out a Top 5 unchanged on two months ago. The Toyota Yaris (+62.3%) steps up to #6, overtaking the Lexus LX (+23.1%) and a freefalling Toyota Hilux (-42.6%). The Toyota RAV4 (+65.7%) soars to #9 while the Toyota Camry (-8.3%) closes out the Top 10. Among newcomers, notice the Haval H6 (#38), Haval Jolion (#47), Nissan Xterra (#50) and Kia Sonet (#75) making the biggest waves.
Previous post: Bahrain January-July 2021: Nissan, Isuzu, MG stand out in market up 9.3%
Previous year: Bahrain Full Year 2020: Toyota Land Cruiser posts 7th straight win in market off -17.5%
Full January-September 2021 Top 35 All-brands and Top 50 models below.
Bahrain January-September 2021 – brands:
| Pos | Brand | Jan-Sep 21 | % | /20 | 7m | FY20 |
| 1 | Toyota | 6,981 | 38.0% | -2.1% | 1 | 1 |
| 2 | Nissan | 1,938 | 10.6% | 33.9% | 2 | 2 |
| 3 | Lexus | 1,330 | 7.2% | 4.2% | 3 | 3 |
| 4 | Hyundai | 1,249 | 6.8% | 1.0% | 4 | 4 |
| 5 | Isuzu | 1,075 | 5.9% | 41.6% | 5 | 5 |
| 6 | Kia | 765 | 4.2% | 4.7% | 6 | 6 |
| 7 | Honda | 670 | 3.6% | 3.4% | 7 | 7 |
| 8 | MG | 577 | 3.1% | 25.7% | 9 | 10 |
| 9 | Mazda | 576 | 3.1% | 9.1% | 8 | 8 |
| 10 | Mitsubishi | 503 | 2.7% | -17.4% | 10 | 9 |
| 11 | Changan | 355 | 1.9% | 45.5% | 11 | 12 |
| 12 | Ford | 305 | 1.7% | 53.3% | 12 | 13 |
| 13 | Jeep | 299 | 1.6% | 28.9% | 13 | 14 |
| 14 | Haval | 224 | 1.2% | new | 17 | – |
| 15 | Land Rover | 178 | 1.0% | -13.2% | 14 | 15 |
| 16 | Chevrolet | 175 | 1.0% | -28.9% | 15 | 11 |
| 17 | Hino | 173 | 0.9% | 96.6% | 16 | 17 |
| 18 | Suzuki | 124 | 0.7% | 18.1% | 18 | 18 |
| 19 | Renault | 102 | 0.6% | -26.1% | 20 | 16 |
| 20 | Dodge | 100 | 0.5% | -2.0% | 19 | 19 |
| 21 | GMC | 98 | 0.5% | 6.5% | 23 | 20 |
| 22 | Genesis | 87 | 0.5% | 234.6% | 22 | 25 |
| 23 | Cadillac | 81 | 0.4% | 55.8% | 21 | 23 |
| 24 | Peugeot | 81 | 0.4% | new | 24 | 31 |
| 25 | Infiniti | 78 | 0.4% | 56.0% | 25 | 22 |
| 26 | Subaru | 47 | 0.3% | -38.2% | 26 | 21 |
| 27 | Great Wall | 39 | 0.2% | new | 27 | – |
| 28 | Ram | 34 | 0.2% | -2.9% | 28 | 27 |
| 29 | Volvo | 30 | 0.2% | -9.1% | 29 | 24 |
| 30 | Jaguar | 26 | 0.1% | -44.7% | 30 | 26 |
| 31 | Lincoln | 20 | 0.1% | 17.6% | 31 | 29 |
| 32 | Maserati | 18 | 0.1% | 12.5% | 32 | 30 |
| 33 | Aston Martin | 10 | 0.1% | n/a | 33 | – |
| 34 | Jetour | 8 | 0.0% | new | – | – |
| 35 | Chrysler | 6 | 0.0% | -45.5% | 34 | 32 |
| 36 | Fiat | 1 | 0.0% | -50.0% | 35 | 34 |
Bahrain January-September 2021 – models:
| Pos | Brand | Model | Jan-Sep 21 | % | /20 | 7m | FY20 |
| 1 | TOYOTA | LAND CRUISER SW | 2,075 | 11.3% | 8.8% | 1 | 1 |
| 2 | NISSAN | SUNNY | 935 | 5.1% | 69.7% | 2 | 5 |
| 3 | ISUZU | TF | 860 | 4.7% | 51.4% | 3 | 6 |
| 4 | TOYOTA | COROLLA | 698 | 3.8% | 8.9% | 4 | 4 |
| 5 | TOYOTA | HIACE | 691 | 3.8% | 37.1% | 5 | 7 |
| 6 | TOYOTA | YARIS | 641 | 3.5% | 62.3% | 8 | 11 |
| 7 | LEXUS | LX | 507 | 2.8% | 23.1% | 6 | 8 |
| 8 | TOYOTA | HILUX | 504 | 2.7% | -42.6% | 7 | 2 |
| 9 | TOYOTA | RAV4 | 449 | 2.4% | 65.7% | 9 | 13 |
| 10 | TOYOTA | CAMRY | 398 | 2.2% | -8.3% | 11 | 12 |
| 11 | LEXUS | ES | 381 | 2.1% | -8.9% | 10 | 10 |
| 12 | HYUNDAI | ACCENT | 351 | 1.9% | -32.5% | 13 | 9 |
| 13 | TOYOTA | LAND CRUISER H/D | 334 | 1.8% | 71.3% | 12 | 22 |
| 14 | TOYOTA | PRADO | 319 | 1.7% | -52.6% | 14 | 3 |
| 15 | HYUNDAI | ELANTRA | 229 | 1.2% | 138.5% | 21 | 28 |
| 16 | KIA | PEGAS | 224 | 1.2% | 23.1% | 16 | 18 |
| 17 | MITSUBISHI | L200 | 220 | 1.2% | -24.7% | 15 | 16 |
| 18 | NISSAN | X-TRAIL | 218 | 1.2% | 78.7% | 17 | 33 |
| 19 | NISSAN | KICKS | 216 | 1.2% | 60.0% | 18 | 17 |
| 20 | HONDA | CR-V | 200 | 1.1% | 70.9% | 19 | 34 |
| 21 | HYUNDAI | SONATA | 194 | 1.1% | 340.9% | 24 | 63 |
| 22 | TOYOTA | AVALON | 193 | 1.1% | -30.3% | 20 | 19 |
| 23 | MG | 5 | 188 | 1.0% | 20.5% | 22 | 25 |
| 24 | ISUZU | N-SERIES | 181 | 1.0% | 9.7% | 25 | 23 |
| 25 | JEEP | WRANGLER | 166 | 0.9% | 58.1% | 28 | 44 |
| 26 | MAZDA | CX-5 | 163 | 0.9% | 5.2% | 29 | 31 |
| 27 | NISSAN | PATROL | 162 | 0.9% | -30.8% | 27 | 20 |
| 28 | NISSAN | URVAN | 156 | 0.8% | -27.4% | 23 | 21 |
| 29 | HONDA | CIVIC | 155 | 0.8% | 82.4% | 26 | 41 |
| 30 | HYUNDAI | TUCSON | 150 | 0.8% | -32.1% | 30 | 15 |
| 31 | MG | ZS | 145 | 0.8% | 154.4% | 33 | 55 |
| 32 | KIA | SPORTAGE | 138 | 0.8% | 0.7% | 40 | 39 |
| 33 | MAZDA | CX-9 | 130 | 0.7% | 7.4% | 31 | 38 |
| 34 | TOYOTA | RUSH | 126 | 0.7% | -28.0% | 43 | 26 |
| 35 | TOYOTA | FJ CRUISER | 125 | 0.7% | -31.7% | 36 | 24 |
| 36 | MITSUBISHI | ATTRAGE | 123 | 0.7% | 146.0% | 32 | 64 |
| 37 | HONDA | HR-V | 121 | 0.7% | -14.8% | 35 | 35 |
| 38 | Haval | H6 | 114 | 0.6% | new | 47 | – |
| 39 | KIA | SELTOS | 112 | 0.6% | -5.9% | 34 | 37 |
| 40 | TOYOTA | COASTER | 111 | 0.6% | -62.8% | 39 | 14 |
| 41 | HINO | 700 Series | 110 | 0.6% | 168.3% | 38 | 67 |
| 42 | HONDA | ACCORD | 109 | 0.6% | -19.3% | 42 | 30 |
| 43 | MAZDA | 6 | 109 | 0.6% | 0.9% | 41 | 43 |
| 44 | LEXUS | RX | 107 | 0.6% | -17.7% | 37 | 36 |
| 45 | CHEVROLET | CAPTIVA | 100 | 0.5% | 63.9% | 44 | 32 |
| 46 | KIA | OPTIMA | 96 | 0.5% | 7.9% | 48 | 49 |
| 47 | Haval | Jolion | 95 | 0.5% | new | 70 | – |
| 48 | LEXUS | NX | 94 | 0.5% | -13.8% | 46 | 40 |
| 49 | MAZDA | 3 | 91 | 0.5% | 31.9% | 45 | 51 |
| 50 | NISSAN | XTERRA | 91 | 0.5% | new | 50 | 202 |
Source: Manufacturers
Keyword: Toyota Land Cruiser and Nissan Sunny top market up 8.7% – Best Selling Cars Blog