
New car sales in Italy slide down -24% year-on-year in November to 106,690 units, an improvement on the -35.7% of October but still a very significant loss. This leads to a year-to-date tally up 8.9% to 1,386,108 registrations. As a result we have upped our 2021 Forecast slightly to 1.47 million units. Private sales drop -26.2% year-on-year to 68,410 units and 64.1% share vs. 66% a year ago, self-registrations are down -24.9% to 9,985 and 9.4% vs. 9.5%, long term leases limit their fall to -13.7% at 19,822 units and 18.6% share vs. 16.4% a year ago, while short-term rentals implode at -62.4% to just 1,520 and 1.4% share vs. 2.9% last year and company sales resist at -6.6% to 6,953 and 6.5% share vs. 5.3% in November 2020. Year-to-date, private sales gain 7.3% to 870,084 and 62.8% share vs. 63.7% over the same period in 2020, self-registrations edge down -2.1% to 134,256 and 9.7% share vs. 10.8% last year, long term leases soar 24.3% to 242,160 and 17.5% share vs. 15.3% a year ago, short-term rentals dip down -2.3% to 62,462 and 4.5% share vs. 5% and company sales improve by 17.8% to 77,146 and 5.6% share vs. 5.1% last year.
In terms of fuel type, petrol skids down -34.3% in November to 28,656 and 26.9% share vs. 31.1% in November 2020, diesel implodes -50.3% to 20,247 and 19% share vs. 29% a year ago and GPL drops -12% to 9,862 and 9.2% share vs. 8% last year. Alternatively fuelled vehicles on the other hand excel. HEV is up 3.5% to 33,474 and 31.4% share vs. 23% a year ago, including 9,156 full hybrid (+19.9%) and 24,318 mild hybrid (-1.6%). PHEV is up 12.4% to 5,560 and 5.2% share vs. 3.5% last year, and BEV is up 44.3% to 6,958 and 6.5% share vs. 3.4% a year ago. Year-to-date, petrol is down -14.2% to 414,554 and 29.9% share vs. 38% over the same period in 2020, diesel is hit -26.7% to 315,167 and 22.7% share vs. 33.8% and GPL is up 15.7% to 100,620 and 7.3% share vs. 6.8%. HEV soars 103.1% to 400,976 and 28.9% share vs. 15.5% last year, including 93,801 full hybrid (+65.1%) and 307,175 mild hybrid (+118.5%). PHEV surges 202.4% to 63,652 and 4.6% share vs. 1.7% and BEV is up 142.6% to 61,331 and 4.4% share vs. 2% over the first 11 months of 2020.
In the brands ranking, the top two sellers all fall faster than the market and lose share year-on-year: Fiat is down -28.5% to 14.6% share vs. 15.3% so far this year while Volkswagen skids -26.6% to 8.3% share vs. 8.6% YTD. Toyota (-16.5%) resists better and stays in third position but it’s Dacia (+2.4%) that lodges the only year-on-year gain in the Top 9, edging up one spot on October to #4 overall. It distances sister brand Renault (-37.1%), Ford (-41.9%), Peugeot (-41%), Citroen (-36%) and Jeep (-40.4%) all in freefall. Below, both Kia (+38.1%) and Hyundai (+44.1%) blissfully ignore the negative context and post splendid double-digit year-on-year upticks. We then have to wait until #23 to find another carmaker in positive: DR Motor (+165%) reaching 1.1% share vs. 0.5% so far the year. Cupra (+2845.8%), Tesla (+66.5%), Porsche (+34.6%), Lexus (+25.7%), Great Wall (+10.7%), Subaru (+8.8%), Ferrari (+7.5%) and DS (+6.5%) also advance further down.
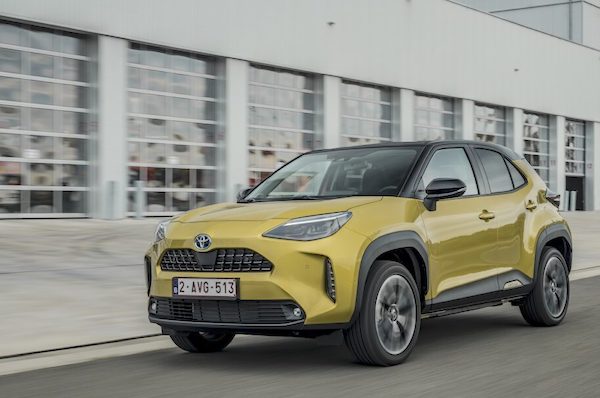
Model-wise, the Fiat Panda (-19.2%) easily retains the pole position, selling 2.7 times the amount of the #2, the Lancia Ypsilon (-23.9%) up one spot on last month to #2. The Dacia Duster scores the only year-on-year gain in the Top 6 and soars 29% to land in third place overall. Dacia even places two nameplates in the November Top 4 with the Sandero (-20.4%) up four ranks on October to #4. The Fiat 500 (-31.5%) is knocked down three spots to #5 while the Citroen C3 (-18%) is down two to #6. The best performance in the Top 10 goes to the new Toyota Yaris Cross up 8 ranks on last month to break into the Italian Top 10 for the first time at #7. However this success seems to be cannibalising the Yaris which is down an abysmal -89.8% year-on-year and steps out of the Top 50 altogether. The VW T-Roc (+25.1%) is the only additional Top 10 gainer just as the Jeep Compass (-40.3%) and Renegade (-36.7%) fall heavily. Notice also a swan song for the Ford Ecosport (+471%) at #11, the VW Polo up 31.4%, the Toyota C-HR up 84.5% to a new record #17 (previous best #22 in April 2018), the Hyundai Tucson up 160.1%, Kia Sportage up 122.4% and Toyota RAV4 up 65.4%. Finally the Renault Arkana breaks into the Italian Top 50 for the first time at #42.
Previous month: Italy October 2021: Fiat Panda hits highest share in 32 years, Toyota Yaris Cross up to #15, market down -35.7%
One year ago: Italy November 2020: Toyota Yaris, Fiat 500 can’t prevent market back down -8.2%
Full November 2021 Top 45 All-brands and Top 50 models below.
Italy November 2021 – brands:
| Pos | Brand | Nov-21 | % | /20 | Oct | 2021 | % | /20 | Pos | FY20 |
| 1 | Fiat | 15,251 | 14.6% | -28.5% | 1 | 210,053 | 15.3% | 9.6% | 1 | 1 |
| 2 | Volkswagen | 8,723 | 8.3% | -26.6% | 2 | 118,532 | 8.6% | 2.6% | 2 | 2 |
| 3 | Toyota | 6,437 | 6.2% | -16.5% | 3 | 78,812 | 5.7% | 24.9% | 4 | 6 |
| 4 | Dacia | 6,338 | 6.1% | 2.4% | 5 | 57,039 | 4.2% | 14.4% | 9 | 10 |
| 5 | Renault | 5,842 | 5.6% | -37.1% | 4 | 69,794 | 5.1% | -9.6% | 6 | 4 |
| 6 | Ford | 4,832 | 4.6% | -41.9% | 6 | 77,271 | 5.6% | -6.7% | 5 | 3 |
| 7 | Peugeot | 4,657 | 4.5% | -41.0% | 7 | 78,838 | 5.7% | 7.0% | 3 | 5 |
| 8 | Citroen | 4,376 | 4.2% | -36.0% | 11 | 61,956 | 4.5% | 4.8% | 7 | 7 |
| 9 | Jeep | 4,182 | 4.0% | -40.4% | 12 | 59,747 | 4.4% | 10.4% | 8 | 8 |
| 10 | Kia | 3,872 | 3.7% | 38.1% | 9 | 41,808 | 3.0% | 24.7% | 15 | 15 |
| 11 | Hyundai | 3,842 | 3.7% | 44.1% | 8 | 42,625 | 3.1% | 34.5% | 14 | 17 |
| 12 | BMW | 3,519 | 3.4% | -27.9% | 10 | 48,138 | 3.5% | 13.3% | 12 | 12 |
| 13 | Opel | 3,356 | 3.2% | -30.2% | 17 | 51,347 | 3.7% | 2.1% | 11 | 9 |
| 14 | Audi | 3,290 | 3.1% | -39.5% | 16 | 52,721 | 3.8% | 14.5% | 10 | 11 |
| 15 | Mercedes | 3,232 | 3.1% | -23.7% | 13 | 44,569 | 3.3% | 4.3% | 13 | 13 |
| 16 | Lancia | 3,207 | 3.1% | -23.9% | 15 | 41,469 | 3.0% | 8.3% | 16 | 14 |
| 17 | Suzuki | 2,497 | 2.4% | -32.2% | 14 | 37,833 | 2.8% | 21.8% | 17 | 16 |
| 18 | Nissan | 2,350 | 2.2% | -20.9% | 18 | 25,545 | 1.9% | -1.2% | 18 | 18 |
| 19 | Mini | 1,643 | 1.6% | -20.0% | 20 | 16,486 | 1.2% | 7.1% | 22 | 23 |
| 20 | Seat | 1,476 | 1.4% | -31.0% | 22 | 20,006 | 1.5% | 1.4% | 20 | 20 |
| 21 | Volvo | 1,420 | 1.4% | -6.3% | 19 | 17,942 | 1.3% | 16.4% | 21 | 22 |
| 22 | Skoda | 1,348 | 1.3% | -41.0% | 24 | 23,634 | 1.7% | 3.2% | 19 | 19 |
| 23 | DR Motor | 1,121 | 1.1% | 165.0% | 23 | 7,533 | 0.5% | 140.6% | 26 | 34 |
| 24 | Alfa Romeo | 954 | 0.9% | -52.0% | 26 | 10,326 | 0.8% | -33.5% | 25 | 21 |
| 25 | Mazda | 873 | 0.8% | -1.7% | 21 | 11,858 | 0.9% | 25.0% | 23 | 25 |
| 26 | Cupra | 707 | 0.7% | 2845.8% | 29 | 5,825 | 0.4% | 7273.4% | 29 | n/a |
| 27 | Porsche | 669 | 0.6% | 34.6% | 30 | 5,378 | 0.4% | 2.2% | 31 | 27 |
| 28 | Smart | 624 | 0.6% | -14.3% | 28 | 6,402 | 0.5% | 58.2% | 27 | 29 |
| 29 | Land Rover | 583 | 0.6% | -32.9% | 25 | 11,269 | 0.8% | 5.9% | 24 | 24 |
| 30 | Honda | 538 | 0.5% | -8.3% | 27 | 6,080 | 0.4% | -4.1% | 28 | 26 |
| 31 | Lexus | 450 | 0.4% | 25.7% | 31 | 4,364 | 0.3% | 18.3% | 32 | 30 |
| 32 | Tesla | 438 | 0.4% | 66.5% | 38 | 5,411 | 0.4% | 87.8% | 30 | 32 |
| 33 | DS | 378 | 0.4% | 6.5% | 32 | 4,289 | 0.3% | 1.1% | 33 | 28 |
| 34 | MG | 256 | 0.2% | new | 36 | 674 | 0.0% | new | 41 | – |
| 35 | Subaru | 222 | 0.2% | 8.8% | 34 | 2,153 | 0.2% | 14.8% | 36 | 35 |
| 36 | Jaguar | 219 | 0.2% | -42.7% | 35 | 3,877 | 0.3% | 17.4% | 34 | 33 |
| 37 | Mitsubishi | 213 | 0.2% | -1.8% | 33 | 3,771 | 0.3% | -1.3% | 35 | 31 |
| 38 | Maserati | 121 | 0.1% | -32.8% | 37 | 1,500 | 0.1% | 23.1% | 37 | 36 |
| 39 | Mahindra | 48 | 0.0% | -39.2% | 40 | 805 | 0.1% | -28.0% | 38 | 37 |
| 40 | Ferrari | 43 | 0.0% | 7.5% | 41 | 569 | 0.0% | 16.6% | 42 | 39 |
| 41 | SsangYong | 37 | 0.0% | -48.6% | 39 | 762 | 0.1% | -28.8% | 39 | 38 |
| 42 | Great Wall | 31 | 0.0% | 10.7% | 42 | 738 | 0.1% | 123.0% | 40 | 40 |
| 43 | Lamborghini | 15 | 0.0% | -11.8% | 43 | 288 | 0.0% | 10.3% | 43 | 41 |
| 44 | Aston Martin | 1 | 0.0% | -83.3% | 44 | 44 | 0.0% | 4.8% | 44 | 42 |
| – | Others | 247 | 0.2% | 404.1% | – | 1,085 | 0.1% | 165.9% | – | – |
Italy November 2021 – models:
| Pos | Model | Nov-21 | % | /20 | Oct | 2021 | % | /20 | Pos | FY20 |
| 1 | Fiat Panda | 8,815 | 8.3% | -19.2% | 1 | 105,616 | 7.6% | 4.2% | 1 | 1 |
| 2 | Lancia Ypsilon | 3,208 | 3.0% | -23.9% | 3 | 41,525 | 3.0% | 8.4% | 3 | 2 |
| 3 | Dacia Duster | 2,994 | 2.8% | 29.0% | 16 | 24,288 | 1.8% | 4.7% | 14 | 15 |
| 4 | Dacia Sandero | 2,971 | 2.8% | -20.4% | 8 | 27,982 | 2.0% | 10.2% | 8 | 10 |
| 5 | Fiat 500 | 2,918 | 2.7% | -31.5% | 2 | 42,181 | 3.0% | 58.0% | 2 | 5 |
| 6 | Citroen C3 | 2,673 | 2.5% | -18.0% | 4 | 29,813 | 2.2% | 12.2% | 7 | 9 |
| 7 | Toyota Yaris Cross | 2,657 | 2.5% | new | 15 | n/a | n/a | new | n/a | – |
| 8 | VW T-Roc | 2,420 | 2.3% | 25.1% | 11 | 27,074 | 2.0% | 25.9% | 10 | 12 |
| 9 | Jeep Compass | 2,197 | 2.1% | -40.3% | 6 | 26,781 | 1.9% | 11.1% | 11 | 11 |
| 10 | Jeep Renegade | 2,087 | 2.0% | -36.7% | 7 | 33,116 | 2.4% | 16.7% | 4 | 6 |
| 11 | Ford Ecosport | 2,010 | 1.9% | 471.0% | 21 | 10,994 | 0.8% | -15.6% | 39 | 30 |
| 12 | Renault Clio | 1,959 | 1.8% | -34.4% | 13 | 24,623 | 1.8% | -16.9% | 13 | 4 |
| 13 | Renault Captur | 1,879 | 1.8% | -53.4% | 5 | 25,797 | 1.9% | 3.4% | 12 | 8 |
| 14 | VW Polo | 1,866 | 1.7% | 31.4% | 14 | 19,200 | 1.4% | -8.4% | 19 | 18 |
| 15 | Opel Corsa | 1,677 | 1.6% | -27.2% | 22 | 24,197 | 1.7% | 4.5% | 15 | 13 |
| 16 | Fiat 500L | 1,611 | 1.5% | -7.8% | 26 | 16,739 | 1.2% | -3.7% | 21 | 22 |
| 17 | Toyota C-HR | 1,555 | 1.5% | 84.5% | 38 | 11,982 | 0.9% | 11.9% | 37 | 34 |
| 18 | VW T-Cross | 1,552 | 1.5% | -49.8% | 10 | 22,809 | 1.6% | 9.3% | 17 | 17 |
| 19 | Peugeot 208 | 1,546 | 1.4% | -30.2% | 24 | 22,058 | 1.6% | 5.8% | 18 | 16 |
| 20 | Peugeot 2008 | 1,440 | 1.3% | -43.1% | 9 | 23,947 | 1.7% | 40.5% | 16 | 21 |
| 21 | Peugeot 3008 | 1,334 | 1.3% | -7.0% | 28 | 19,146 | 1.4% | 13.3% | 20 | 23 |
| 22 | Hyundai i10 | 1,295 | 1.2% | 10.6% | 18 | 12,999 | 0.9% | 28.4% | 31 | 37 |
| 23 | BMW X1 | 1,232 | 1.2% | -10.3% | 32 | 12,215 | 0.9% | 31.9% | 35 | 38 |
| 24 | Nissan Qashqai | 1,215 | 1.1% | -41.0% | 35 | 10,484 | 0.8% | -33.8% | 42 | 24 |
| 25 | Kia Picanto | 1,137 | 1.1% | 15.1% | 27 | 12,911 | 0.9% | 44.2% | 32 | 43 |
| 26 | Hyundai Tucson | 1,108 | 1.0% | 160.1% | 19 | 14,119 | 1.0% | 125.2% | 25 | n/a |
| 27 | VW Up! | 1,089 | 1.0% | -16.7% | 37 | 9,998 | 0.7% | -3.4% | 45 | 35 |
| 28 | Kia Sportage | 1,083 | 1.0% | 122.4% | 25 | 10,157 | 0.7% | 37.1% | 43 | n/a |
| 29 | Ford Puma | 1,054 | 1.0% | -56.9% | n/a | 27,315 | 2.0% | 23.4% | 9 | 14 |
| 30 | Fiat Tipo | 1,041 | 1.0% | -20.9% | 30 | 15,953 | 1.2% | 2.9% | 22 | 26 |
| 31 | Suzuki Swift | 1,037 | 1.0% | -28.5% | 20 | 13,621 | 1.0% | 45.4% | 27 | 40 |
| 32 | Fiat 500X | 1,013 | 0.9% | -66.7% | 48 | 29,872 | 2.2% | 3.6% | 6 | 3 |
| 33 | Volvo XC40 | 953 | 0.9% | 13.2% | 42 | 11,114 | 0.8% | 27.9% | 38 | 42 |
| 34 | Citroen C3 Aircross | 842 | 0.8% | -27.2% | n/a | 13,371 | 1.0% | 8.8% | 28 | 31 |
| 35 | Mercedes A Class | 835 | 0.8% | -22.2% | 34 | 10,519 | 0.8% | -11.1% | 41 | 32 |
| 36 | Mini Countryman | 816 | 0.8% | -14.0% | n/a | 8,430 | 0.6% | n/a | 49 | n/a |
| 37 | Suzuki Ignis | 809 | 0.8% | -38.3% | 23 | 14,100 | 1.0% | 32.5% | 26 | 33 |
| 38 | Ford Kuga | 807 | 0.8% | -29.1% | 31 | 12,874 | 0.9% | 46.1% | 33 | 39 |
| 39 | Opel Crossland | 806 | 0.8% | -44.4% | n/a | 12,206 | 0.9% | -16.6% | 36 | 27 |
| 40 | Alfa Romeo Stelvio | 801 | 0.8% | -26.8% | n/a | 6,713 | 0.5% | -10.1% | n/a | 48 |
| 41 | Toyota RAV4 | 799 | 0.7% | 65.4% | 33 | 8,441 | 0.6% | 39.9% | 48 | n/a |
| 42 | Renault Arkana | 796 | 0.7% | new | n/a | n/a | n/a | new | n/a | – |
| 43 | Opel Mokka | 787 | 0.7% | n/a | 43 | n/a | n/a | n/a | n/a | n/a |
| 44 | Mini Hatch | 752 | 0.7% | -23.2% | 50 | n/a | n/a | n/a | n/a | n/a |
| 45 | Audi A1 | 749 | 0.7% | -9.1% | n/a | n/a | n/a | n/a | n/a | n/a |
| 46 | Seat Arona | 740 | 0.7% | n/a | n/a | 8,575 | 0.6% | n/a | 47 | 47 |
| 47 | Renault Twingo | 686 | 0.6% | n/a | n/a | n/a | n/a | n/a | n/a | n/a |
| 48 | Kia Stonic | 665 | 0.6% | n/a | 36 | n/a | n/a | n/a | n/a | n/a |
| 49 | Nissan Juke | 635 | 0.6% | n/a | 46 | n/a | n/a | n/a | n/a | n/a |
| 50 | Audi Q3 | 604 | 0.6% | -48.2% | 39 | 12,729 | 0.9% | 22.6% | 34 | 36 |
| n/a | Audi A3 | 597 | 0.6% | -43.5% | n/a | 10,030 | 0.7% | 27.0% | 44 | 45 |
| n/a | Ford Focus | 568 | 0.5% | -64.3% | 17 | 9,051 | 0.7% | -30.7% | 46 | 29 |
| n/a | VW Golf | 500 | 0.5% | -73.8% | n/a | 14,125 | 1.0% | -22.4% | 24 | 20 |
| n/a | BMW Serie 1 | 465 | 0.4% | -56.3% | 45 | 10,772 | 0.8% | 23.7% | 40 | 44 |
| n/a | Citroen C1 | 463 | 0.4% | -58.8% | n/a | 7,994 | 0.6% | 15.0% | 50 | 49 |
| n/a | Toyota Yaris | 462 | 0.4% | -89.8% | 29 | 31,151 | 2.2% | 26.3% | 5 | 7 |
| n/a | VW Tiguan | 430 | 0.4% | -69.7% | n/a | 15,036 | 1.1% | -5.5% | 23 | 25 |
| n/a | Dacia Spring | 416 | 0.4% | new | 12 | 4,691 | 0.3% | new | n/a | – |
| n/a | Toyota Aygo | 342 | 0.3% | -67.7% | 41 | 13,190 | 1.0% | 2.0% | 29 | 28 |
| n/a | Ford Fiesta | 83 | 0.1% | -96.4% | n/a | 13,165 | 0.9% | -35.9% | 30 | 19 |
Source: UNRAE
Keyword: Toyota Yaris Cross up to #7, sales down -24% – Best Selling Cars Blog