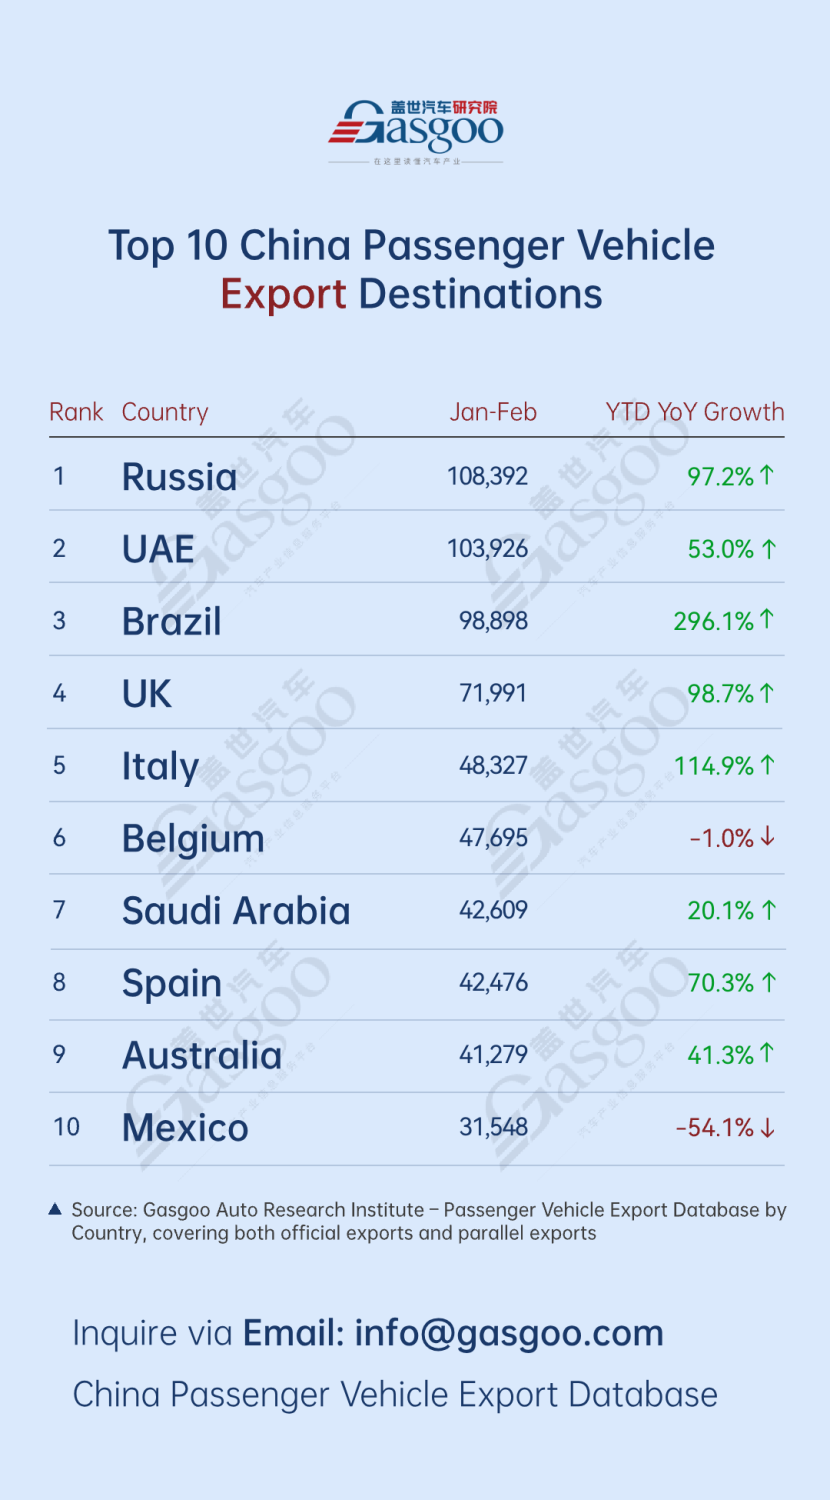
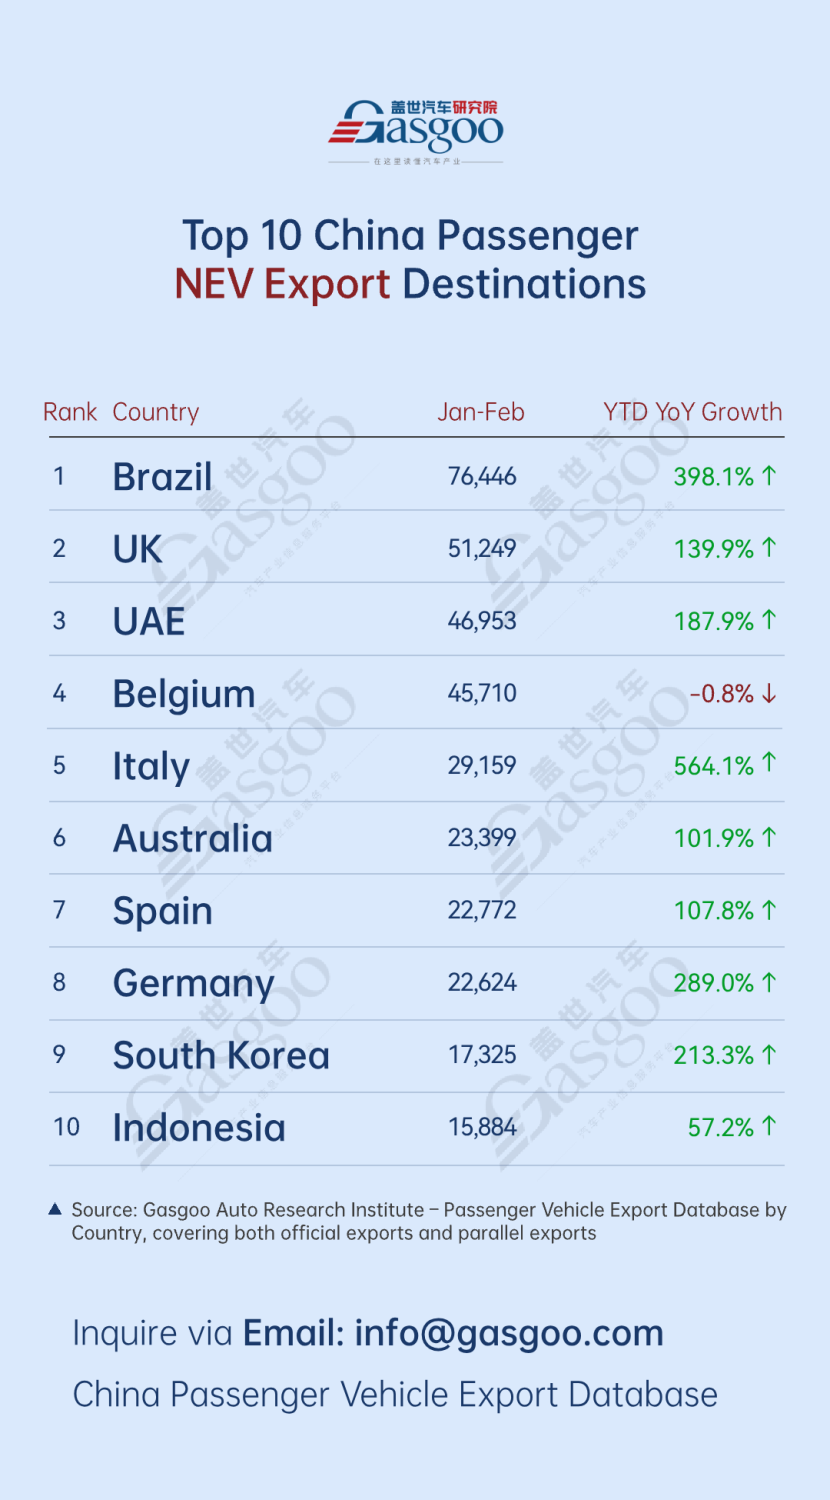
According to Gasgoo Automotive Research Institute, China's passenger vehicle and new energy passenger vehicle exports continued to expand in scale while showing clearer structural divergence for the Jan. - Feb. 2026 period. Passenger vehicle exports remained driven by key markets such as Russia, the UAE, and Brazil, supported by price and channel advantages. Meanwhile, new energy vehicle (NEV) exports saw broader penetration across Europe and other regions, with Brazil, the UK, and several European countries among the top destinations, reflecting a more diversified market mix.Top 10 destination countries by China's passenger vehicle exportsRussia: 108,392 units (+97.2% YoY) from January to February 2026UAE: 103,926 units (+53.0% YoY) from January to February 2026Brazil: 98,898 units (+296.1% YoY) from January to February 2026UK: 71,991 units (+98.7% YoY) from January to February 2026Italy: 48,327 units (+114.9% YoY) from January to February 2026Belgium: 47,695 units (–1.0% YoY) from January to February 2026Saudi Arabia: 42,609 units (+20.1% YoY) from January to February 2026Spain: 42,476 units (+70.3% YoY) from January to February 2026Australia: 41,279 units (+41.3% YoY) from January to February 2026Mexico: 31,548 units (–54.1% YoY) from January to February 2026From the distribution of China's passenger vehicle export destinations in Jan–Feb 2026, Russia (108,392 units), the UAE (103,926 units), and Brazil (98,898 units) ranked as the top three, forming the core pillars of exports. Leveraging strong price competitiveness and rapid channel expansion, Chinese automakers have continued to grow their market share. Amid external changes, Russia has emerged as the largest incremental market during this period.Meanwhile, the European market showed strong growth momentum. The UK (71,991 units), Italy (48,327 units), and Spain (42,476 units) all recorded robust YoY growth, reflecting continued progress by Chinese brands in new energy product rollout and channel development. However, Belgium (47,695 units) saw a slight decline, indicating that Europe remains influenced by policy, trade dynamics, and local competition. Overall, growth in the region is still somewhat uncertain and driven more by structural opportunities than broad-based expansion.The Latin American market showed clear divergence. Brazil (98,898 units) recorded strong growth driven by policy tailwinds and concentrated product launches, becoming a key source of incremental volume. In contrast, Mexico (31,548 units) saw a sharp decline, partly due to anticipated tariff hikes in 2026, with some demand pulled forward to late 2025. This divergence highlights that Chinese automakers' performance in the region remains highly dependent on individual countries' policy cycles and market conditions.In addition, the Middle East maintained steady growth. The UAE (103,926 units) and Saudi Arabia (42,609 units) continued to see rising demand, supported by strong purchasing power, favorable policies, and improving distribution networks, gradually evolving from supplementary markets into stable, high-volume destinations. Overall, China's passenger vehicle exports are shifting from reliance on single-market growth to a more balanced, multi-regional structure. The growth model is also transitioning from pure volume expansion to a more comprehensive competition driven by products, branding, and channel capabilities.Top 10 destination countries by China's new energy passenger vehicle exportsBrazil: 76,446 NEV passenger vehicles (+398.1% YoY) from January to February 2026UK: 51,249 NEV passenger vehicles (+139.9% YoY) from January to February 2026UAE: 46,953 NEV passenger vehicles (+187.9% YoY) from January to February 2026Belgium: 45,710 NEV passenger vehicles (-0.8% YoY) from January to February 2026Italy: 29,159 NEV passenger vehicles (+564.1% YoY) from January to February 2026Australia: 23,399 NEV passenger vehicles (+101.9% YoY) from January to February 2026Spain: 22,772 NEV passenger vehicles (+107.8% YoY) from January to February 2026Germany: 22,624 NEV passenger vehicles (+289.0% YoY) from January to February 2026Korea: 17,325 NEV passenger vehicles (+213.3% YoY) from January to February 2026Indonesia: 15,884 NEV passenger vehicles (+57.2% YoY) from January to February 2026From the perspective of China's NEV export destinations in Jan–Feb 2026, Brazil (76,446 units), the UK (51,249 units), and the UAE (46,953 units) ranked in the top three, forming the leading tier. Unlike traditional ICE vehicle exports, NEVs achieved a more balanced presence across both emerging and developed markets—scaling rapidly in high-growth markets like Brazil while continuing to penetrate mature markets such as the UK.Europe's role in NEV exports has strengthened, with the UK (51,249 units), Belgium (45,710 units), Italy (29,159 units), Spain (22,772 units), and Germany (22,624 units) all ranking in the top ten. This growth is driven by Europe's accelerating electrification, temporary gaps in local supply, and the cost and product advantages of Chinese brands in BEVs. However, Belgium's slight decline also highlights ongoing volatility amid changes in policies, subsidies, and trade conditions.In terms of growth rates, emerging markets and some European countries saw rapid expansion. Italy (29,159 units) surged 564.1% YoY, followed by Brazil (76,446 units, +398.1% YoY), Germany (22,624 units, +289.0% YoY), and South Korea (17,325 units, +213.3% YoY), highlighting the accelerating adoption of NEVs across regions.In addition, the Asia-Pacific and Middle East markets maintained steady expansion. Australia (23,399 units), South Korea (17,325 units), and Indonesia (15,884 units) all recorded solid growth, while the UAE (46,953 units) continued to scale. This indicates that NEVs are gradually shifting from policy-driven to demand-driven growth, with increasingly replicable growth paths across more regions.