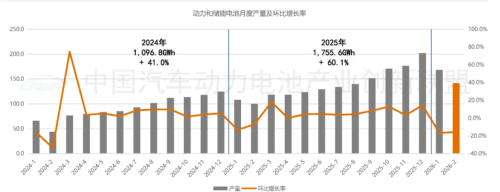
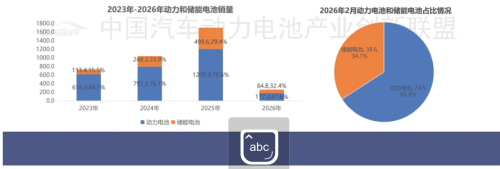
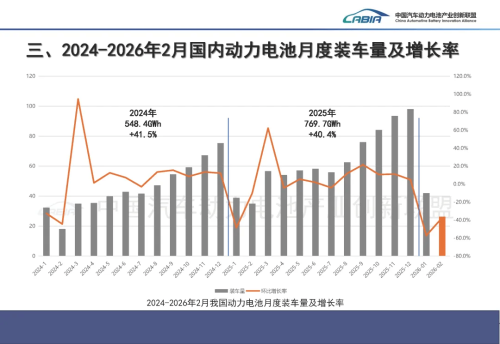
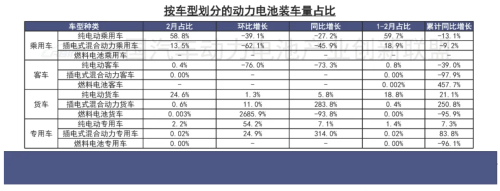
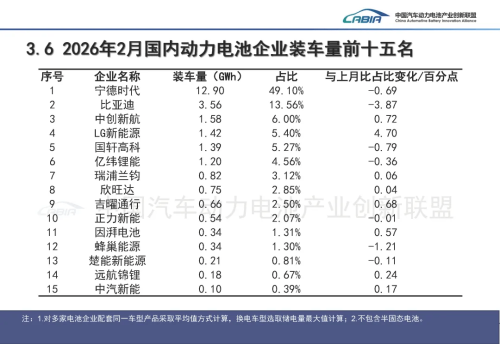
The top ten battery manufacturers recorded combined installations of 24.8 GWh, accounting for 94.3% of total installations. Latest data from the China Automotive Battery Innovation Alliance show that China’s total production of power and energy storage batteries reached 141.6 GWh in February 2026, down 15.7% month-on-month but up 41.3% year-on-year. Production and growth rates of EV batteries from 2014 to Feb 2026 Cumulative production for January and February totaled 309.7 GWh, representing year-on-year growth of 48.8%. In terms of sales, combined power and energy storage battery sales in February reached 113.2 GWh, down 23.9% month-on-month but up 25.7% year-on-year. Among them, power battery sales reached 74.5 GWh, accounting for 65.9% of total sales, while energy storage battery sales totaled 38.6 GWh. Cumulative sales for the first two months reached 262.0 GWh, up 53.8% year-on-year. Sales volume of power and energy storage batteries from 2023 to Feb 2026 Exports continued to grow. In February, China exported 23.9 GWh of power and energy storage batteries, representing a year-on-year increase of 13.2% and accounting for 20.6% of total monthly sales. Among these, power battery exports reached 16.9 GWh, while energy storage battery exports totaled 7.0 GWh. Cumulative exports for January and February reached 48.0 GWh, up 24.6% year-on-year. Driven by demand from the new energy vehicle market, battery installations remain a key indicator for the industry. In February, domestic power battery installations reached 26.3 GWh, representing a year-on-year decline of 24.6%. Battery installations from February 2024 to Feb 2026 in China By battery type, lithium iron phosphate (LFP) batteries continued to dominate, with installations reaching 20.6 GWh in the month and accounting for 78.3% of the total. Ternary batteries recorded installations of 5.7 GWh. During the first two months of the year, cumulative domestic power battery installations reached 68.3 GWh, down 7.2% year-on-year. Among them, LFP batteries accounted for 53.3 GWh, while ternary batteries totaled 15.1 GWh. From the perspective of vehicle types, battery electric vehicles remained the primary source of battery installations. In February, BEVs accounted for 85.9% of total installations, while plug-in hybrid vehicles accounted for 14.1%. Fuel cell vehicles represented only 0.003%. Market share percentages of different types of EVs and growth between Feb and the cumulative comparison for 1-2 months. In terms of the competitive landscape, the power battery sector remains highly concentrated. A total of 30 battery manufacturers achieved installation support in February, eight fewer than in the same period last year. The top ten companies recorded combined installations of 24.8 GWh, accounting for 94.3% of total installations. Among them, CATL ranked first with installations of 12.9 GWh and a market share of 49.1%. BYD ranked second with 3.56 GWh and a market share of 13.56%. Top 15 battery manufacturers in battery installation volume for Feb 2026 in China Together, the two companies accounted for about 62.66% of the domestic power battery market. They were followed by CALB, LG Energy Solution, Gotion High-Tech and EVE Energy, with February installations of 1.58 GWh, 1.42 GWh, 1.39 GWh and 1.20 GWh respectively. Overall, despite fluctuations in the scale of the NEV market, the power battery industry remains highly concentrated, with leading companies continuing to maintain stable market shares.