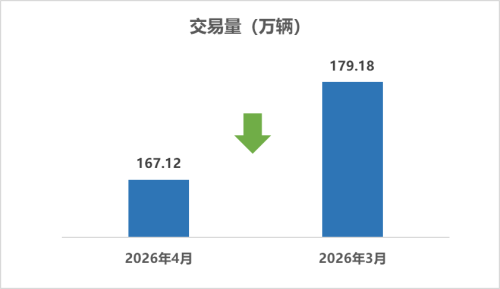
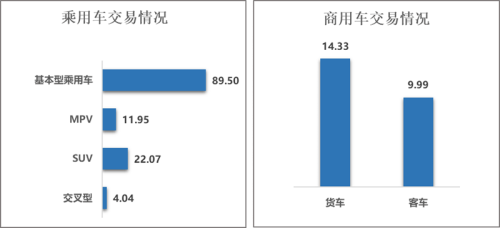
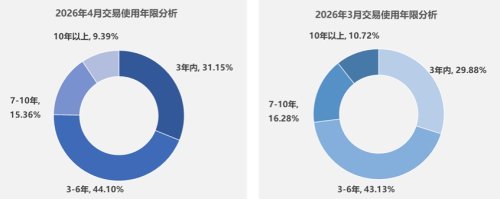
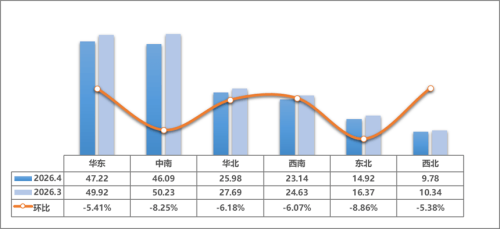
China’s used car market entered a correction phase in April. Post-holiday recovery momentum faded; transactions fell both month-on-month and year-on-year. Data comes from the China Automobile Dealers Association, released on May 14. Total transactions reached 1.6712 million units in April. That marks a 6.73% MoM decline; a 1.76% YoY drop. Transaction value totaled RMB 113.476 billion ($16.45 billion). For the first four months, the market maintained moderate growth. Cumulative transactions hit 6.4932 million units, up 2.93% YoY. That represents an increase of 184,600 units from the same period last year. Total transaction value stood at RMB 426.358 billion ($61.82 billion). China’s used car transactions in Apr and Feb 2026 By vehicle type, passenger cars saw broad MoM declines. Only MPVs posted YoY growth. Basic passenger car transactions reached 895,000 units. That is down 7.58% MoM; down 6.73% YoY. SUV transactions totaled 220,700 units, falling 6.57% MoM and 2.13% YoY. Cross-type passenger vehicles reached 40,400 units, down 7.19% MoM and 7.02% YoY. In contrast, MPVs bucked the trend. A total of 119,500 MPVs changed hands in April. That is down 6.13% MoM; up 7.92% YoY. China’s used passenger car transactions in Apr 2026 Commercial vehicles showed mixed performance. Buses extended YoY growth; trucks turned negative year-on-year. Bus transactions reached 99,900 units, down 6.82% MoM but up 6.63% YoY. Truck sales hit 143,300 units, down 6.63% MoM and 2.89% YoY. The age structure of traded vehicles continues to grow younger. China’s used car by age structures in Apr and Feb 2026 Cars aged 3–6 years accounted for the largest share at 44.10%, up 0.3 percentage points YoY. Meanwhile, the share of vehicles under three years old rose to 31.15%, a 4.2 percentage point YoY increase. Vehicles aged 7–10 years accounted for 15.36%. Those over 10 years made up 9.39%. The market shows accelerating inflow of newer vehicles; shrinking share of older models. Regionally, all six major regions posted MoM declines in transactions. China’s used car by regional distributions in Apr and Feb 2026 Northeast China saw the sharpest drop at 8.86% MoM. Northwest China recorded the smallest decline at 5.38% MoM; remained the most stable region. East China retained its leading position with 472,200 units traded. Cross-regional circulation remained active. The transfer rate of used vehicles reached 32.33% in April. That is up 0.24 percentage points MoM; up 2.27 percentage points YoY. Total transfers reached 540,200 units. That marks a 6.03% MoM decline; a 5.66% YoY increase.