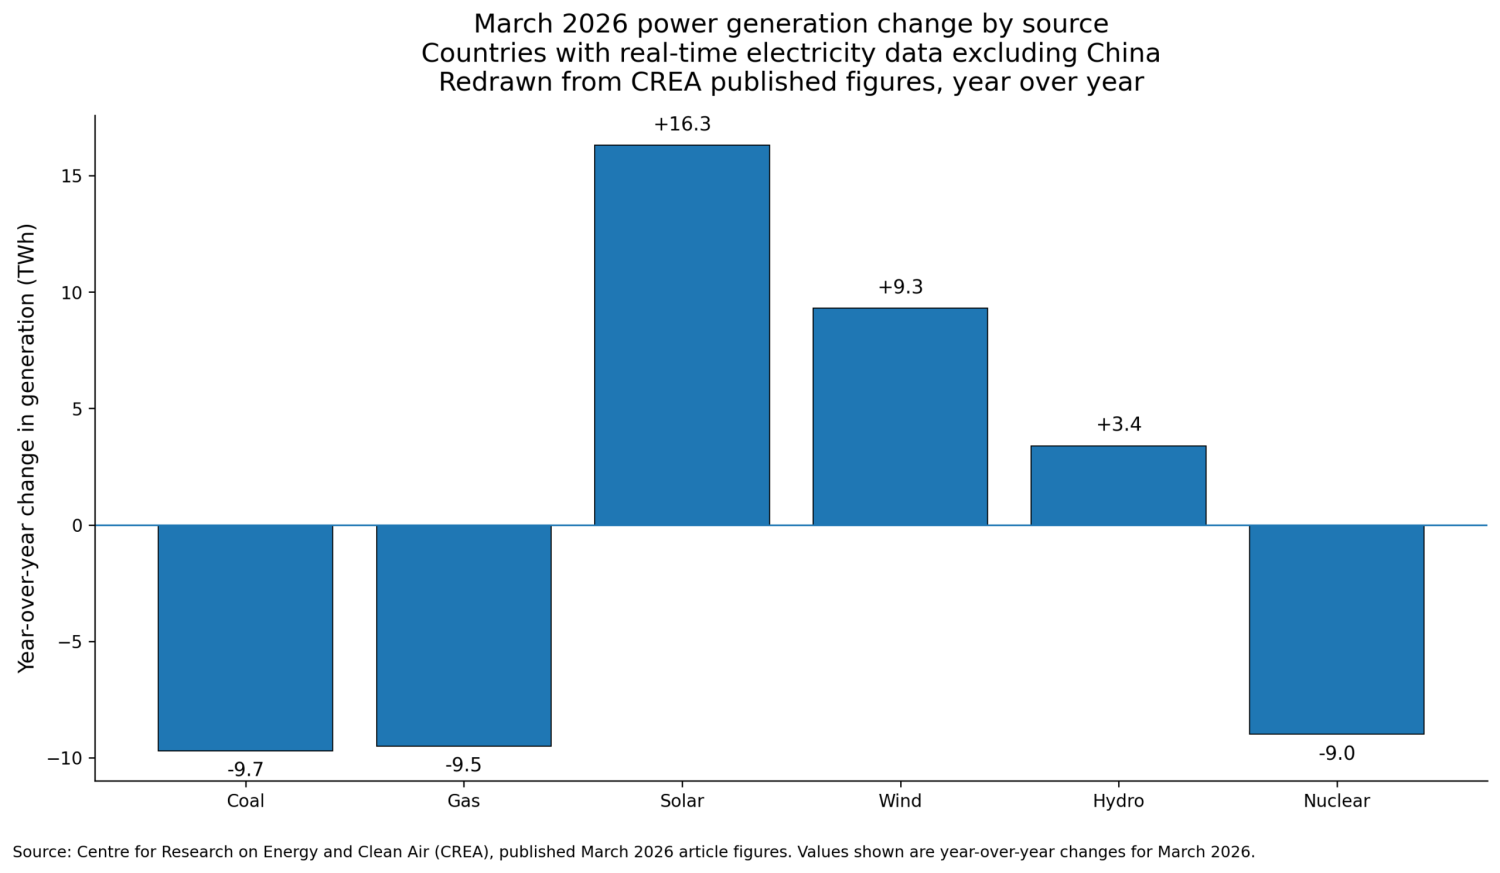
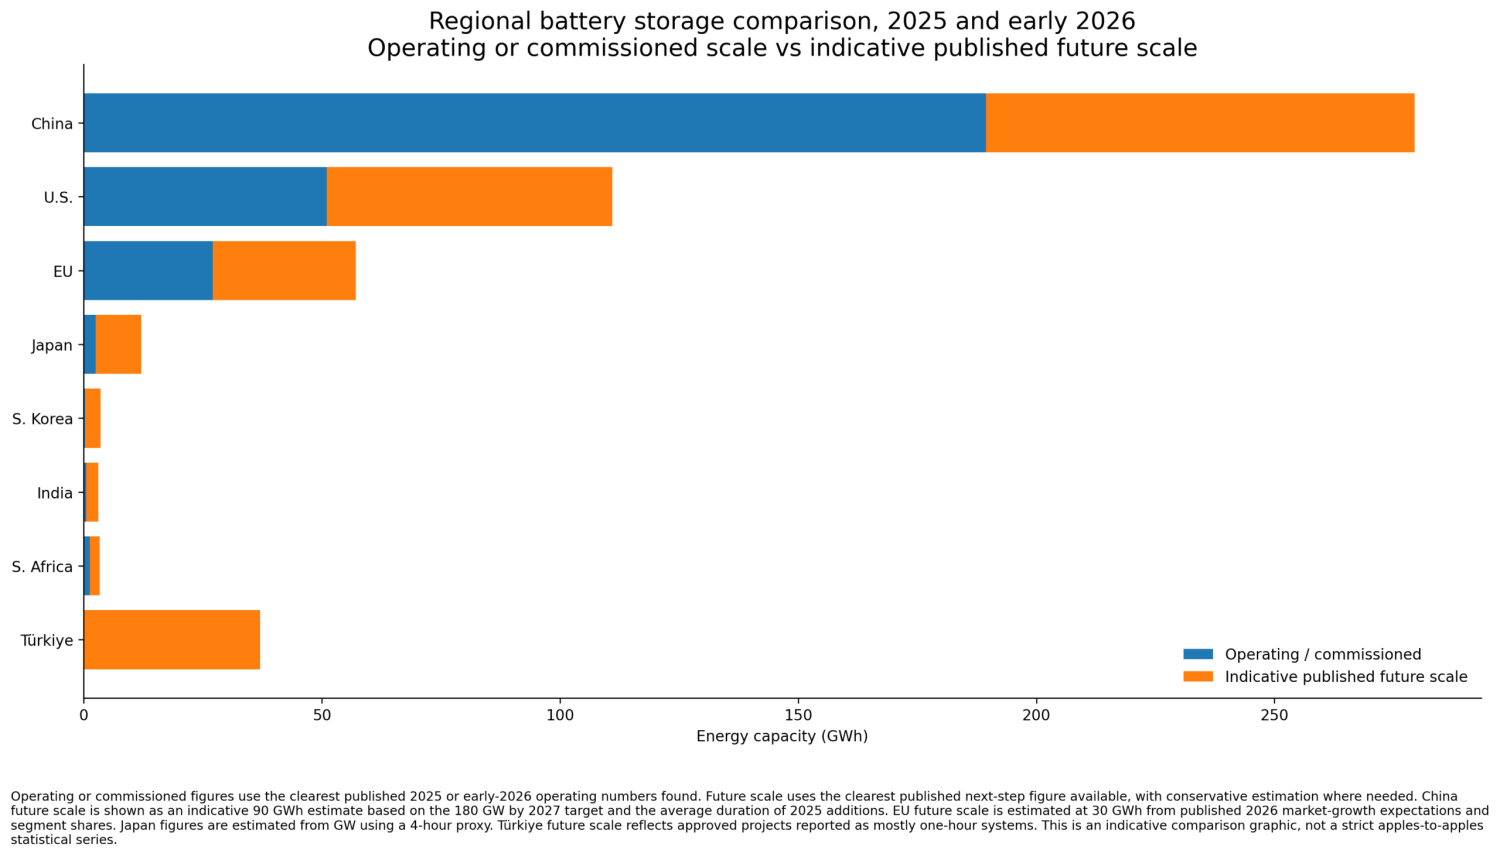
The easiest story to tell after the Strait of Hormuz disruption was that coal would be the winner. It had the virtue of sounding like common sense. If LNG cargoes are delayed, diverted, or repriced, then gas-fired generation becomes less attractive or less available, while coal plants that are already built can run harder. In a narrow dispatch sense, that story has some truth. But the moment the claim is stated broadly, it starts to fall apart under data. The Centre for Research on Energy and Clean Air’s (CREA) March 2026 analysis of real-time electricity data found that global fossil generation fell 1% year on year, with coal roughly flat and gas down 4%, not the global coal rebound many people expected. Outside China, in countries with real-time data, coal generation fell 3.5% and gas fell 4.0%, while solar rose 14% and wind rose 8%. That is not a picture of coal sweeping the board. It is a picture of a power system portfolio leaning on whatever non-fossil flexibility it already has when gas becomes exposed. Year-over-year changes in March 2026 electricity generation outside China, redrawn from CREA figures That matters, because the phrase “coal is the winner” compresses three different questions into one slogan. The first is short-term marginal dispatch. The second is medium-term system response over weeks and months. The third is long-term investment logic after planners and utilities have watched another imported fuel supply chain wobble under geopolitical stress. Coal can gain on the first question in some regions and still lose on the second and third. The reason is simple arithmetic. A gas shock does not force every grid to choose between gas and coal. It forces each grid to lean harder on its actual portfolio, including solar, wind, hydro, nuclear, storage, imports, transmission, and demand flexibility. Once those are in the frame, the “winner” language starts to look less like analysis and more like a hangover from a simpler era of thermal competition. CREA’s data set covered 87% of global coal generation and more than 60% of gas-fired generation, which makes it broad enough to test the slogan against real operating outcomes rather than intuition. The first thing CREA did right was to separate what happened outside China from what happened globally. In the countries with real-time data excluding China, coal generation fell by 9.7 TWh in March, a 3.4% decline. Gas generation fell by 9.5 TWh, a 4.0% decline. Solar increased by 16.3 TWh, wind by 9.3 TWh, and hydro by 3.4 TWh. Nuclear fell by about 9 TWh, which means the renewable increase was not merely displacing gas and coal. It was also covering nuclear weakness in some systems while still keeping total generation slightly higher. That set of changes is important because it shows replacement at the level that matters, actual electricity sent onto grids, not just fuel price spreads. It also shows that the first-order substitute for disrupted LNG in many markets is not coal at all. It is the combination of solar, wind, hydro, and whatever flexibility the system already has to move those electrons into the hours that matter. China is where the broader coal thesis keeps a foothold, but only a partial one. CREA reported that China’s coal-fired generation rose 2% in March as some coastal provinces switched from gas to coal. Yet gas is only about 3% of China’s power mix, which limits how much switching can occur in the first place. That is why global coal ended up broadly flat instead of rising sharply. China matters enormously because of its scale, but it also illustrates why the slogan misleads. A small increase in coal burn in a giant system is not the same thing as a global power-sector verdict that coal is back. It is a regional adaptation inside a system that is also deploying wind, solar, transmission, and batteries at a pace no other country matches. In other words, the country that preserved the strongest coal counterexample is also the country most aggressively building the assets that reduce the need for imported gas over time. The country-level picture makes the nuance clearer. CREA identified Japan and South Korea as major places where coal generation rose. The United States, India, South Africa, Türkiye, Germany, and the Netherlands saw some of the larger coal declines in March. That split makes sense. Japan and South Korea are large LNG-importing economies with meaningful coal fleets and limited domestic renewable resources compared with continental systems. In an LNG shock, coal can gain there. But even in those countries, the gain is better understood as emergency hedge behavior than as a durable strategic win. The United States and Germany, by contrast, already have enough renewable, transmission, market, and storage depth that gas stress does not automatically map into more coal generation. India, South Africa, Türkiye, and the Netherlands each have their own constraints, but they too show that the old thermal switch is no longer the only game in town. Coal trade data reinforce the point. CREA reported that seaborne coal shipments in March were about 104 million tons, down 3% year on year and the weakest March level since 2021. Shipments to China and India were down 9%, to Türkiye down 25%, and to Vietnam down 27%, although Japan, Indonesia, Malaysia, and the Philippines saw increases. That is not what a broad-based coal resurgence looks like. It looks instead like a patchwork regional response inside a market where coal is already mature, already constrained, and in many countries already running where economics and policy still allow it. If coal were the clear global beneficiary of the Hormuz disruption, the trade figures would be expected to show a stronger pulse. They did not. That does not mean coal was irrelevant. It means its room to grow was narrower than its defenders implied. In many grids, the easy coal-for-gas switching had already happened years earlier whenever coal was still competitive and available. The more important question is what actually replaced LNG’s role when gas came under pressure. Part of the answer was the familiar low-carbon stack that critics often leave out of these arguments. Solar and wind produced more. Hydro contributed where water conditions allowed. Nuclear mattered where units were online. Interconnected grids imported from neighbors. Demand shifted where market signals were strong enough. None of that is speculative. It is how power systems operate. CREA’s comparison between Hormuz-exposed LNG and the 2025 renewables buildout captured the scale of this shift. The LNG trade passing through Hormuz in 2025 was around 112 bcm, equal to roughly 19% of global LNG trade and, in CREA’s estimate, enough fuel for about 590 TWh of power generation. By contrast, the world added about 510 GW of solar and 160 GW of wind in 2025, enough to produce roughly 1,100 TWh annually. That is not a one-for-one comparison in every hour or every place, because gas is dispatchable and solar and wind are variable. But it is a crucial systems comparison. The annual clean electricity capability added in a single year was about 1.9 times the generation equivalent of the LNG trade exposed to Hormuz. Put more plainly, the world is now adding enough renewable output in one year to overwhelm the annual electricity equivalent of a major LNG chokepoint. Regional battery storage is now operating at large enough scale in China, the U.S., and the EU to affect daily grid balancing That is where batteries enter the story, because renewables without storage still leave critics an opening. If the argument is only about annual TWh, LNG defenders can reply that power systems live or die in particular hours. On that point they are right, but only partly. The role of gas most exposed today is not every role gas ever played. It is the peaking, ramping, reserve, and short-duration balancing role that batteries are increasingly good at replacing. Reuters reported that global battery storage installations rose 43% in 2025. The United States installed 18.9 GW of battery storage across utility-scale, commercial, and residential segments in 2025, up 52% from 2024 according to ACP and Wood Mackenzie. The EU added 27.1 GWh in 2025, up 45%, taking total installed battery capacity to 77.3 GWh. These are no longer demonstration numbers. They are fleet numbers. They are large enough to alter dispatch, price formation, reserve procurement, curtailment patterns, and evening ramp management in several major markets. China is the clearest case that renewables plus batteries are already replacing a material share of the roles once assigned to gas and coal. According to CNESA data reported by PV Magazine and Energy Storage News, China added 66.43 GW and 189.48 GWh of new-type energy storage in 2025 alone. That took non-pumped storage capacity to about 144.7 GW by year end, within a broader power-system storage total above 200 GW. The average duration of the 2025 additions was about 2.85 hours if measured as 189.48 GWh divided by 66.43 GW. Even a more conservative figure reported for new-type storage projects entering operation in 2025, about 2.58 hours, still describes a fleet built for daily balancing rather than niche services. Public monthly data show that China also commissioned 3.78 GW and 10.90 GWh in January 2026, followed by 3.56 GW and 8.19 GWh in February. In two months, that is another 7.34 GW and 19.09 GWh, close to one-third of the entire installed battery fleet of some advanced economies. When a country is adding storage at that pace while also dominating solar and wind additions, it is no longer reasonable to describe LNG-backed thermal generation as the natural balancing partner by default. The United States is the second strong example. ACP and Wood Mackenzie’s 18.9 GW figure for 2025 is national and includes all segments, but the operating reality is concentrated in markets where batteries are reshaping daily dispatch. ERCOT is the most visible. Modo Energy reported that commercially operational battery capacity in ERCOT reached 14.96 GW and 24.6 GWh at the end of Q1 2026 after 1.1 GW came online in a single quarter across 20 projects. ERCOT materials from early February 2026 separately cited 15,712 MW of installed and operating battery capacity in Texas. If one uses the Modo end-Q1 figure, the average fleet duration was about 1.64 hours. If one uses the ERCOT presentation, the power figure is a bit higher but tells the same story. This is a short-duration fleet, but that is exactly the point. Short-duration batteries do not need to replace all thermal generation to crush the economics of LNG peakers. They only need to own the high-value hours around late afternoon and evening ramps, ancillary services, and rapid response. In markets with strong solar output, that role used to belong to gas by default. In parts of the U.S., it no longer does. Europe sits between the U.S. and Asia in this story, with stronger deployment than many critics acknowledge but more fragmentation across markets. Reuters and SolarPower Europe both reported 27.1 GWh of new battery capacity installed in the EU in 2025, bringing the total to 77.3 GWh. Germany was one of the strongest utility-scale markets. Modo Energy reported that Germany added 842 MW of grid-scale battery capacity in 2025, taking the grid-scale fleet to 2.4 GW and 3.5 GWh by year end. That implies an average duration of about 1.46 hours for the connected grid-scale fleet, still short-duration but already meaningful for arbitrage and balancing in a system where thermal capacity is shrinking. Germany’s queue is much larger than its connected fleet, which is a useful reminder that ambition and operation are not the same thing. Still, 2.4 GW of connected grid-scale batteries in Germany is enough to matter every day. The Netherlands is smaller and harder to pin down with a single current operating number, but Statistics Netherlands reported that large batteries above 1 MWh stood at 350 MW and 620 MWh at the end of 2024, while Dutch sector reporting projected total installed battery capacity across all segments at 2.9 GWh by end-2025. So for Germany and the Netherlands, the right reading is that batteries are already relevant, though still not at the scale of China or the fastest U.S. markets. Japan and South Korea are where the coal-wins story retains more force, but mostly because their battery fleets are not yet large enough in operation, not because the technology case is weak. IEEFA reported that Japan’s grid-scale battery project applications surged from 70 GW to 170.8 GW since mid-2024, yet only 0.62 GW was actually connected by March 2026. That is a market with a huge queue and a tiny operating base. Policy support is stronger than the connected fleet suggests, including Japan’s long-term decarbonization auctions, but the physical deployment gap matters. South Korea shows a similar pattern. The U.S. Commercial Service reported that Korea Power Exchange awarded 65 MW in the first national battery auction in 2024, followed by a much larger 540 MW tender in January 2026 under 15-year contracts. Those are significant policy steps, but they do not amount to an operating battery fleet comparable to what China, Texas, or California already have. So when LNG stress hits Northeast Asia, coal can still gain share because the clean balancing substitute has not yet been built at the same speed as the pipeline and tender rhetoric. India, South Africa, and Türkiye show another version of the same divide between direction and delivery. Mercom reported that India added 547 MWh of battery energy storage capacity in 2025, taking cumulative installed battery capacity to 1,082 MWh by year end. That is growth of 26% over 2024 additions, but it remains small relative to India’s scale. South Africa has procured much larger volumes than it has operating today. Public reporting through 2025 indicated that only two government-backed battery projects were online, totaling 245 MW and 1,240 MWh, even as the broader procurement pipeline was much larger. In February 2026, a 300 MW solar project with 660 MWh of battery storage reached financial close for industrial customers, which is a real step, but it is future capacity, not March operating reality. Türkiye may be the starkest example of pipeline outrunning operation. Ember-related reporting in April 2026 indicated that more than 33 GW of battery projects had been approved since 2022, yet the country’s first major licensed solar-plus-storage project, pairing about 49 MW of solar with 34 MWh of battery storage, was only energized in January 2026. Put bluntly, these are markets where renewables plus batteries clearly can replace LNG in principle and are being set up to do more of it, but where the operating fleet is not yet large enough to dominate short-term crisis response. That operating-versus-planned distinction is the key to the whole argument. Critics often attack the claim that renewables plus batteries replace LNG by pointing to seasonal gaps, multi-day weather events, or long-duration reliability needs. Those are real constraints, but they are not the relevant benchmark for the first wave of displacement. LNG is vulnerable first in the hours where it is expensive, flexible, and not heavily loaded. Batteries are already competing there. If a 2-hour or 4-hour battery shifts midday solar into the evening peak, displaces gas peakers for reserve and regulation, and flattens the ramp that gas used to serve, then part of LNG’s economic role is already gone. The battery does not need to solve every hour of every season to do damage to LNG demand. It only needs to solve enough of the high-margin hours to shrink capacity factors, cut revenues, and make new gas plants or LNG import dependence harder to justify. That is why the average duration figures matter. A 1.5-hour fleet or a 2.5-hour fleet is not a seasonal solution. It is a peaking and balancing solution, and peaking and balancing are where a lot of LNG’s market value sits. This also explains why coal did not get the second life some expected after the Hormuz disruption. In many markets, coal had already captured the dispatch role available to it whenever it was cheaper than gas and still allowed by policy. The spare room for a second round of substitution was limited. Many coal plants are old, inflexible, or nearing retirement. Some countries have supply, environmental, or market constraints that keep coal from ramping sharply even in a fuel crisis. Seaborne coal trade data did not show a major global scramble. And no one returned fleets of retired coal plants to service in March. The physical and commercial system was telling a different story from the slogan. Coal still matters in several regions, and in Japan and South Korea it remained a credible near-term hedge, but as a global answer it looked increasingly like legacy capacity taking a temporary bow, not an asset class regaining strategic leadership. What LNG really lost in the Hormuz episode was not only market share in a single month. It lost more of the presumption that imported gas is the practical default for reliability. Once planners see a chokepoint threaten roughly one-fifth of global LNG trade, they are forced to ask which alternatives are domestic, modular, and less exposed to shipping lanes, military risk, and fuel price spikes. Solar, wind, hydro, transmission, demand response, and batteries are not perfect answers to every reliability challenge, but they do not require tankers crossing Hormuz. Reuters’ reporting on Europe’s and the world’s battery growth, ACP and Wood Mackenzie’s U.S. data, CNESA’s China numbers, and CREA’s March generation analysis all point in the same direction. The systems that had already built clean flexibility were better positioned to absorb the shock without a large fossil rebound. The systems that had not done so still leaned on coal or remained exposed to LNG. That is the dividing line. None of this means batteries solve everything. They do not replace seasonal storage. They do not eliminate the need for transmission expansion. They do not substitute for firm clean generation in every geography. They do not rescue a grid that has underbuilt all forms of flexibility. But that is the wrong standard for judging their effect on LNG. The right standard is whether they are already taking over valuable parts of gas’s job. In China, the U.S., and parts of Europe, the answer is clearly yes. In Japan and South Korea, the answer is not yet at comparable scale, but the policy machinery is moving. In India, South Africa, and Türkiye, the answer is still emerging from a low base. The result is a more nuanced statement than either side of the slogan war usually offers. Coal was not the global winner of the Hormuz shock. It was a regional emergency beneficiary in a few LNG-exposed markets. Renewables alone did not replace LNG everywhere either. But renewables plus batteries, backed by hydro, nuclear, interconnection, and demand flexibility where available, already replaced enough of LNG’s daily balancing role in several major markets to overturn the old assumption that a gas shock naturally belongs to coal. The real strategic winner was not a single fuel. It was the clean flexibility stack, and the countries building it fastest are the ones rewriting what energy security means.