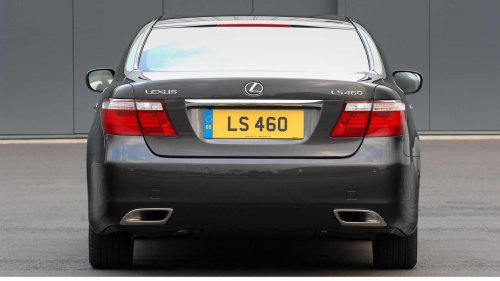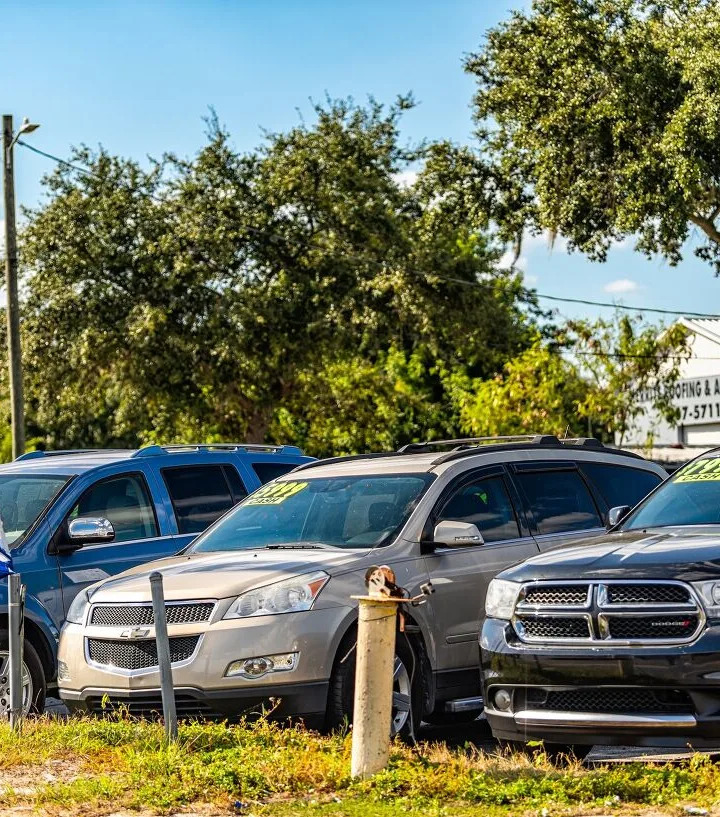



















Here's How Old a Used Car Should Be So You Get the Best DealAutoGuide.comMarcus LewinskyThu, September 24, 2026 at 2:27 AM UTCAdd us on GoogleCredit: Kristi Blokhin / ShutterstockCredit: Kristi Blokhin / ShutterstockStandard used-car buying advice relies on a clean, convenient rule of thumb: buy at year four. The logic appears sound on the surface. By four years, a vehicle has absorbed the steepest portion of its initial depreciation curve while remaining relatively fresh.However, analyzing depreciation data alongside long-term mechanical maintenance trends reveals a structural flaw in that timeline. While buying at year four avoids initial capital loss, it positions the buyer to absorb a sharp, predictable rise in repair costs shortly after taking ownership.AdvertisementAdvertisementOn a recent episode of The AutoGuide Show, we covered how the affordability crisis is impacting even used cars and how a smart plan is to buy a slightly used car with good reliability and drive it for a long, long time. Thanks to a new study by Bumper.com we have some hard data to pinpoint exactly when you'll want to buy to maximize your return.The Problem with Year FourA new vehicle loses roughly 20% to 30% of its initial value within its first 12 months, scaling from an average initial purchase price near $48,841 down to approximately $26,900 by year three. By years five and six, the market value plateaus near $22,000, where the annual loss rate settles into a predictable $1,000 to $1,500 annually.Entering the market at year four lands a buyer close to that value floor, but it forces them to hold the vehicle during its first major mechanical inflection point.Based on Consumer Expenditure Survey data for single-vehicle households, annual maintenance and repair costs follow a distinct trajectory:Vehicle AgeAverage Annual Repair CostMechanical StatusYear 4~$432Pre-spike baselineYear 5~$761+31.2% spike (First major maintenance cycle)Years 6–7StabilizedPost-spike plateau; calm ownership windowYear 8~$1,079+59.4% spike (Secondary longevity cliff)A buyer purchasing at year four enters immediately before the 31.2% cost surge at year five. While year five marks the point where depreciation genuinely flattens, the second owner still absorbs that initial maintenance wave.The Year-Six Entry StrategyEntering the market at year six shifts the ownership profile. By year six:AdvertisementAdvertisementDepreciation is fully absorbed: The initial ~$26,000 in market value depreciation has been realized by previous owners. The vehicle sits at its value floor, losing roughly 6% per year.The year-five maintenance cycle has passed: Major wear items-such as factory brakes, second-tier tires, drive belts, and early suspension components-have typically been addressed by the previous owner during the year-five surge.The vehicle enters a stable corridor: Repair expenditures remain relatively predictable through year seven, creating a stable operating window prior to the steeper maintenance costs that emerge around year eight.Market perception data indicates that buyers rarely target this specific window. In a survey of 2,168 consumers conducted by Bumper, 59% stated that mileage and history were more critical than age alone, while those who focused on vehicle age identified 8–10 years or 11–15 years as primary risk thresholds. Few highlighted the distinction between years four, five and six.The Impact of Brand Tier on Useful LifeThe viability of buying at year six depends heavily on the manufacturer. The used market splits into two distinct categories regarding vehicle longevity, based on scrappage and odometer analysis from Junk Car Medics and NHTSA driving schedules:Tier 1 (Toyota, Lexus, Honda, Acura): Average retirement lifespan of 19.6 years and 180,873 miles.Tier 2 (Mazda, Subaru, Hyundai, Kia, GMC, Chevrolet, Ford, Nissan): Average retirement lifespan of 16.8 years and 155,862 miles.AdvertisementAdvertisementBecause both tiers average virtually identical daily utilization (~25.3 to 25.4 miles per day), longevity differences reflect component durability rather than driving habits.As mileage accumulates, the difference in remaining service life widens between the two tiers:[68,000 Miles] -------------------------------------------------- Tier 1 Remaining Life: 62% Tier 2 Remaining Life: 56% (Gap: 6%) [105,000 Miles] -------------------------------------------------- Tier 1 Remaining Life: 42% Tier 2 Remaining Life: 32% (Gap: 10%) [128,000 Miles] -------------------------------------------------- Tier 1 Remaining Life: 29% Tier 2 Remaining Life: 17% (Gap: 12%)For a Tier 1 vehicle, a year-six purchase occurs with roughly two-thirds of its statistical service life intact. For a Tier 2 vehicle, year six places the car at or past its midpoint, meaning the window before the year-eight repair surge (~$1,079/year) represents a larger portion of the car's remaining usable life.Pre-Purchase ChecklistEvaluating a used vehicle against these cost curves requires looking beyond physical condition and asking five key analytical questions:AdvertisementAdvertisementDetermine the Brand Tier: Tier 1 models offer a wider operating window post-year six. Tier 2 models can still represent good value at year six, but require tighter planned ownership timelines before the year-eight maintenance cliff.Map the Age to the Maintenance Curve: Target year six or seven for entry. Year five captures the depreciation floor but exposes the owner to the immediate 31.2% repair surge. Year seven leaves minimal runway before the 59.4% jump at year eight.Evaluate Remaining Life at Current Odometer: Compare the vehicle's mileage against its tier baseline. At 105,000 miles, a Tier 1 car retains approximately 42% of its usable lifespan, compared to 32% for a Tier 2 vehicle.Benchmark Against the Valuation Floor: Average general-market vehicles level off near $22,000 around years five and six. Prices significantly above this line require specific justification in option packages, trim, or condition.Audit Ownership Duration via History Reports: Examine vehicle history records for short ownership stints (12 months or less) around year five. Multiple rapid ownership changes at this threshold often indicate previous drivers who opted to sell rather than absorb major maintenance events.