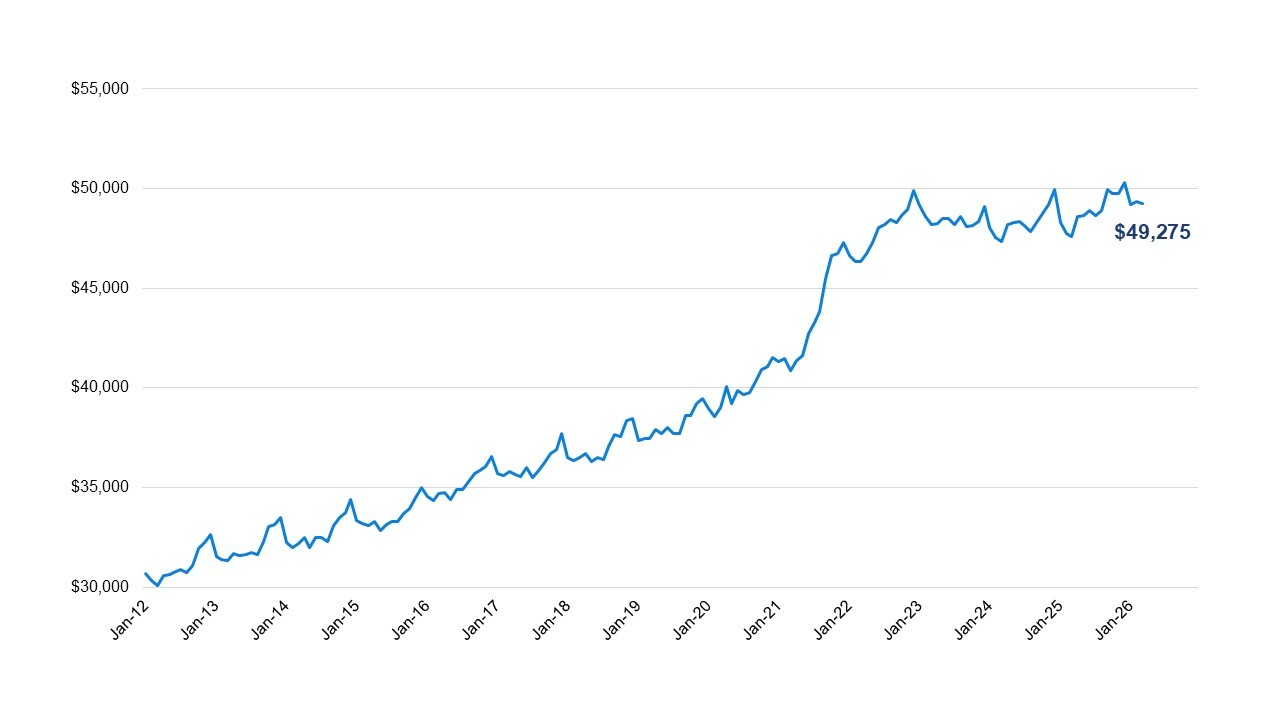
Average new car transaction price in US climbs to $49,275. EV prices fall 2.8 % to $54,508 thanks to sales incentives. Buyers are still choosing big vehicles such as full-size trucks. Here’s some good news if you’ve been eyeing an EV as a way out of buying expensive gas, but also flinching at the price of making the switch. The gap between electric and gas cars just shrank to its smallest level ever. Okay, so $5,800 is not pocket change, but it’s a whole lot less scary than it used to be, and is the kind of difference you could even out with fuel cost savings if you’re a high mileage driver. New EV prices dropped 2.8 percent year over year to $54,508, marking their third straight monthly decline, according to fresh data from Cox Automotive’s Kelley Blue Book. That’s not happening by accident, either. Automakers are throwing incentives at buyers like confetti, with EV discounts now averaging 14.6 percent of transaction price. Meanwhile, gas and hybrid vehicles are holding steady. The industry average transaction (ATP) price landed at $49,275 in March, up 3.5 percent from last year but basically flat compared with February. So while EVs are coming down, ICE models aren’t exactly rushing to meet them halfway. The annual price gains have now accelerated for four consecutive months. The average MSRP reached $51,456, marking the 12th straight month above $50,000. New-Vehicle Average Transaction Price Bigger Is Better What’s really driving the overall numbers, though, is what Americans are actually buying. Spoiler alert, it’s still big stuff, and its not electric. Full-size pickups are hovering near $66,000, while full-size SUVs are knocking on the door of $80,000. At the other end of the spectrum, compact cars are barely moving, up just 1.1 percent year over year and still sitting under $28,000. Even with rising prices, they’re losing relevance as buyers keep chasing space, power, and presence. The brand data adds another layer of intrigue. Porsche buyers clearly didn’t get the memo about tightening American household budgets, with average prices jumping 12.4 percent year over year to $128,447. Cadillac is also riding high with an 11.6 percent increase to $84,139. Mercedes, Tesla Prices Down But not everyone’s winning. Mercedes-Benz prices fell 3.4 percent to $75,886, while Tesla dropped 2.6 percent to $53,142, continuing its quiet price-cut campaign to stay competitive. And then there are incentives across the wider market. They climbed to 7.2 percent of ATP, up from 6.9 percent in February, showing that even as prices stay high, automakers are working harder behind the scenes to keep buyers interested. Average Transaction Price By Automaker AutomakerMar-26Feb-26Mar-25MoMchangeYoYchangeBMW$70,792$71,807$70,515-1.4%0.4%Ford Motor Company$57,170$57,312$54,312-0.2%5.3%Geely Auto Group$61,461$60,268$60,0942.0%2.3%General Motors$53,474$53,325$51,5210.3%3.8%Honda Motor Company$39,125$39,521$38,967-1.0%0.4%Hyundai Motor Group$38,880$39,195$38,139-0.8%1.9%Mazda Motor Corporation$36,229$36,068$36,1600.4%0.2%Mercedes-Benz Group AG$75,886$76,904$78,592-1.3%-3.4%Renault-Nissan-Mitsu Alliance$36,302$36,967$34,224-1.8%6.1%Stellantis$56,366$56,391$53,2880.0%5.8%Subaru Corporation$36,673$37,323$35,058-1.7%4.6%Tata Motors$104,374$103,421$104,7910.9%-0.4%Tesla Motors$53,142$53,798$54,573-1.2%-2.6%Toyota Motor Corporation$46,293$46,651$45,060-0.8%2.7%Volkswagen Group$58,314$58,346$55,244-0.1%5.6%Industry Average$49,275$49,329$47,606-0.1%3.5% SWIPE Average Transaction Price By Brand BrandMar-26Feb-26Mar-25MoMchangeYoYchangeAcura$49,505$49,968$52,525-0.9%-5.7%Audi$62,942$64,334$63,067-2.2%-0.2%BMW$73,226$73,635$72,750-0.6%0.7%Buick$36,888$37,351$35,733-1.2%3.2%Cadillac$84,139$81,667$75,3603.0%11.6%Chevrolet$48,798$48,979$47,199-0.4%3.4%Chrysler$47,484$48,215$48,539-1.5%-2.2%Dodge$50,628$51,376$52,904-1.5%-4.3%Ford$56,482$56,619$53,532-0.2%5.5%Genesis$65,415$64,696$64,5361.1%1.4%GMC$64,649$63,501$65,5061.8%-1.3%Honda$38,033$38,346$37,686-0.8%0.9%Hyundai$37,072$38,280$37,231-3.2%-0.4%Infiniti$66,925$69,269$69,488-3.4%-3.7%Jeep$52,502$51,885$49,2891.2%6.5%Kia$38,295$37,891$36,7561.1%4.2%Land Rover$106,837$104,602$107,2242.1%-0.4%Lexus$62,717$64,189$61,256-2.3%2.4%Lincoln$69,678$70,269$68,265-0.8%2.1%Mazda$36,229$36,068$36,1600.4%0.2%Mercedes-Benz$75,886$76,904$78,592-1.3%-3.4%MINI$42,166$41,668$41,2531.2%2.2%Mitsubishi$32,511$33,750$31,801-3.7%2.2%Nissan$34,845$35,661$32,807-2.3%6.2%Porsche$128,447$125,440$114,2562.4%12.4%Ram$65,754$65,208$62,2880.8%5.6%Subaru$36,673$37,323$35,058-1.7%4.6%Tesla$53,142$53,798$54,573-1.2%-2.6%Toyota$43,684$43,711$42,164-0.1%3.6%Volkswagen$39,939$39,703$37,2250.6%7.3%Volvo$61,376$60,018$59,6252.3%2.9% SWIPE Average Transaction Price By Segment SegmentMar-26Feb-26Mar-25MoMchangeYoYchangeCompact Car$27,469$27,336$27,1680.5%1.1%Compact SUV/Crossover$37,055$36,808$36,2960.7%2.1%Entry-level Luxury Car$59,281$58,111$56,4042.0%5.1%Full-size Pickup Truck$65,964$66,141$64,167-0.3%2.8%Full-size SUV/Crossover$79,500$79,473$75,7570.0%4.9%High Performance Car$129,076$134,010$113,379-3.7%13.8%High-end Luxury Car$122,083$125,088$121,405-2.4%0.6%Luxury Car$61,791$60,929$58,2521.4%6.1%Luxury Compact SUV/Crossover$51,670$52,081$52,384-0.8%-1.4%Luxury Full-size Pickup Truck$92,747$99,698$89,020-7.0%4.2%Luxury Full-size SUV/Crossover$104,580$104,301$101,1210.3%3.4%Luxury Mid-size SUV/Crossover$73,835$74,046$74,182-0.3%-0.5%Lux. Subcompact SUV/Crossover$41,157$40,001$39,1262.9%5.2%Mid-size Car$33,974$33,830$33,5910.4%1.1%Mid-size SUV/Crossover$49,853$50,154$48,475-0.6%2.8%Minivan$47,757$48,058$47,952-0.6%-0.4%Small/Mid-size Pickup Truck$43,042$43,328$41,766-0.7%3.1%Sports Car$47,244$47,295$48,445-0.1%-2.5%Subcompact Car$26,479$24,948$23,3146.1%13.6%Subcompact SUV/Crossover$30,612$30,832$29,957-0.7%2.2%Van$60,485$60,754$59,075-0.4%2.4%Industry Average$49,275$49,329$47,606-0.1%3.5% SWIPE Cox Automotive/KBB, Images Hyundai/Porsche