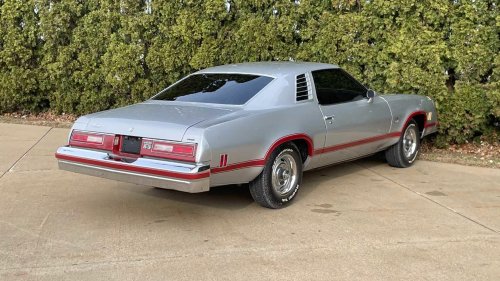
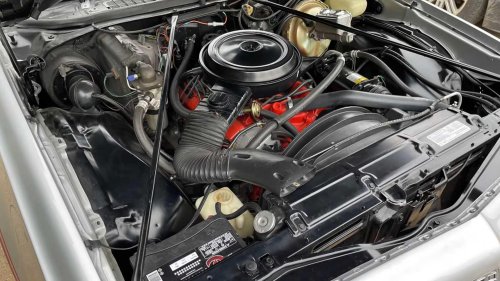
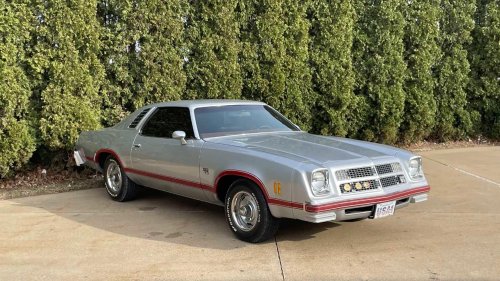
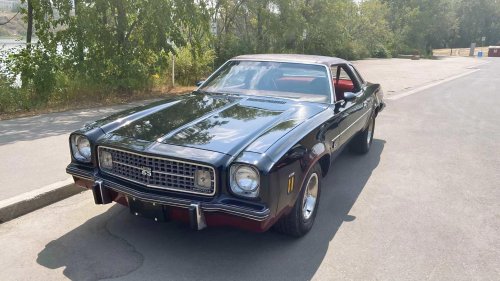
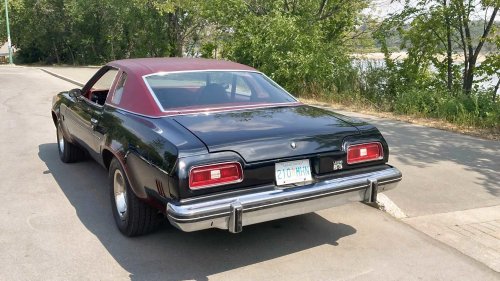
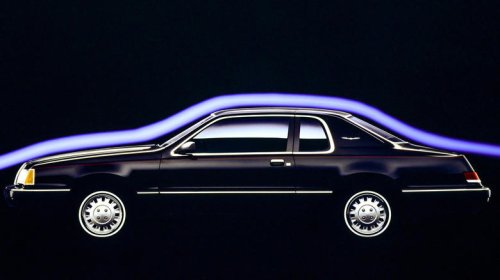
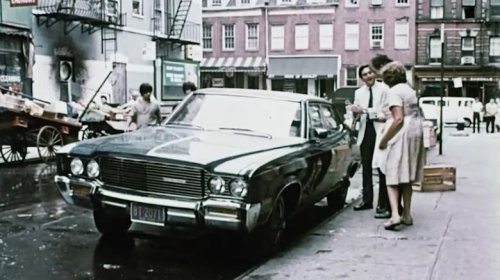
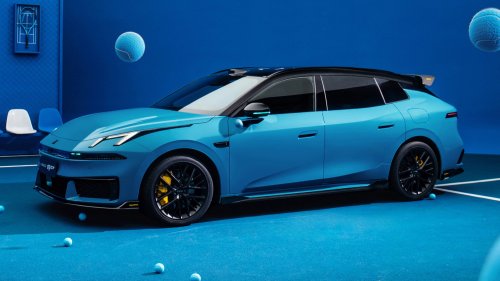
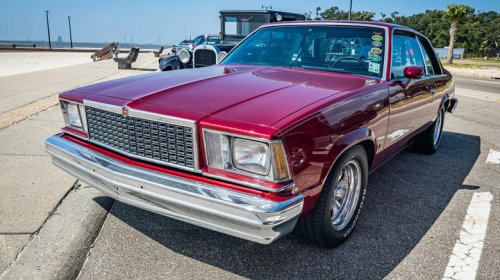
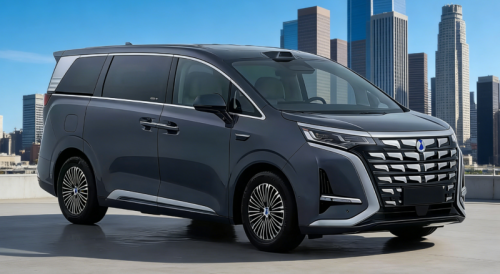
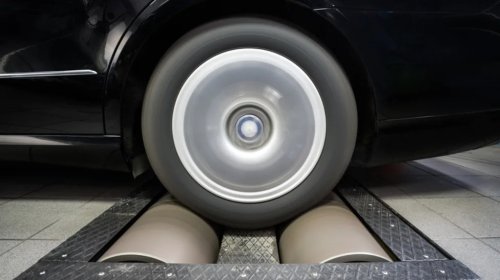
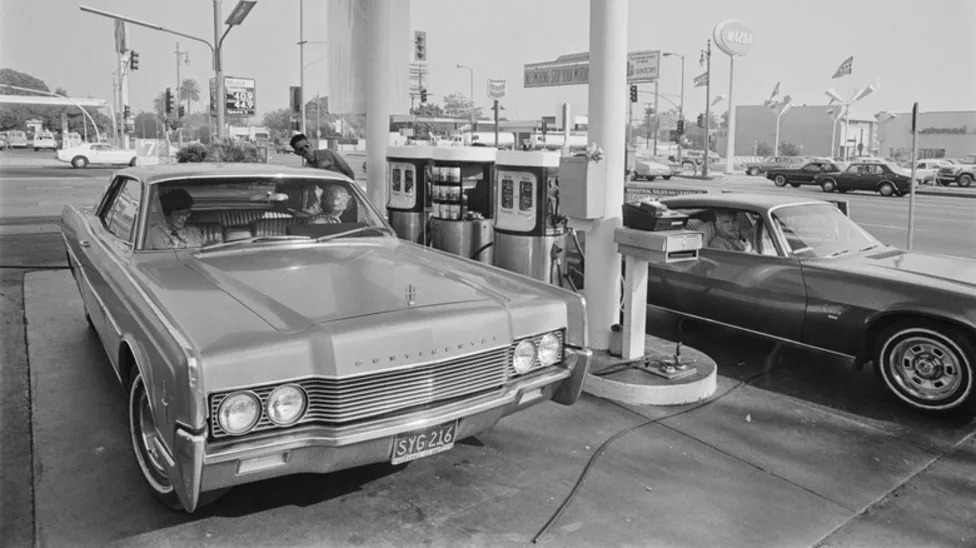
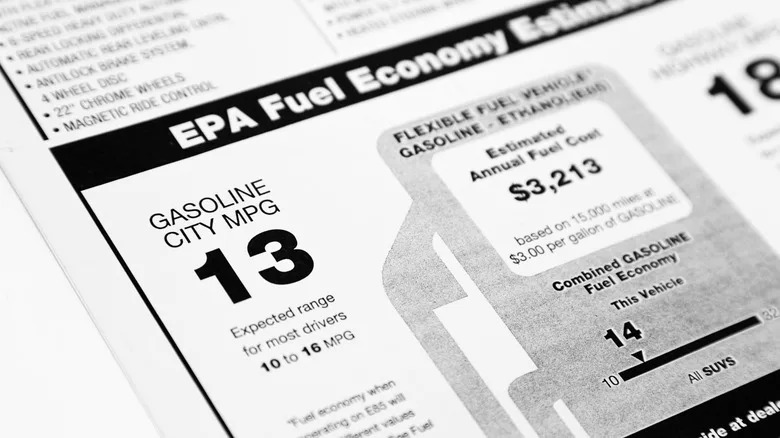
Tony Korody/Getty ImagesComparing eras often raises big questions. Would a modern CGI remake of "Jaws" live up to 1975's mechanical shark masterpiece? Could TikTok dance trends have delayed disco's demise? Should more new cars have a denim-inspired interior like the 1973 AMC Gremlin Levi's Edition? But these are subjective matters. Turning to facts, the Gremlin was lauded for its fuel economy, with an advertised 18 mpg in '74. A 1970 Ford Maverick boasted 22, while a 2026 Ford Maverick can reach 42. We know that's better, but how do average mpg numbers from the '70s compare to the average mpg today? The Energy Information Administration (EIA) indicates that just 8% of our crude oil now comes from the Middle East. Circumstances are different, but echo the oil embargo of 50 years ago, when we relied more heavily on foreign supplies. Long gas lines were commonplace, as the average 1974 U.S. passenger car fuel economy was 13.1 miles per gallon, according to the Environmental Protection Agency. Now, war-related increases in premium gas prices have us reaching for regular, despite today's average mpg being roughly double what it was in the 1970s.The EPA reports that in 2024, the industry reached 33.5 mpg for sedans and wagons, and 39.2 mpg for car-based SUVs. Factoring in trucks and vans drops overall numbers to 27.2. Removing hybrids and EVs lands us at 25.6. Honest progress, but perhaps less than expected based purely on numbers.AdvertisementAdvertisementRead more: When (And Why) Did Cars Switch From Leaded To Unleaded Fuel?The bigger picture of fuel trends and policiesD. Lentz/Getty ImagesEPA historical data shows that in 1975, the Honda Civic reigned with 33.2 mpg, while the Oldsmobile Toronado anchored at 9.8. Honda's still headlining the manufacturer fuel efficiency charts with a 31.0 fleet average, Olds is dead, and Stellantis holds the worst title at 22.8. But there's more to the cross-era fuel economy comp than raw figures. Economic conditions, government policies, vehicle trends, and testing measures lend context to the data. On the economic conditions front, our modern CAFE — or Corporate Average Fuel Economy standards — launched in 1975 due to the aforementioned oil embargo. At the time, gas was about $0.57 a gallon, which sounds like a bargain, but represented a 46% increase from $0.39 just two years prior. That's like jumping from about $1.91 to $3.55 in today's money. CAFE aimed to double fuel economy from model years 1975 and 1985, with a final target of 27.5 mpg. It worked, yielding an astonishing 68% increase in mpg between 1975 and 1987, as recently detailed on page 13 of The 2025 EPA Automotive Trends Report. So, 2024's overall achievement of 27.2 is 0.3 mpg lower(!) than a benchmark set when "Back to the Future" was in theaters? What gives? Well, the report shows that between 1988 and 2004, mpg averages dropped 12%, and progress froze. Gas prices dropped, larger vehicle sales climbed, lobbies kicked in, and Uncle Sam let CAFE standards idle. Testing and legislation changes over timeMccaig/Getty ImagesVehicle trends and EPA testing measures evolved alongside government policies and economic conditions. Fuel economy shot up 41% between 2004 and 2024 thanks to hybrid, turbo, stop/start, PHEV, and EV technologies, and legislation like the 2007 Energy Independence and Security Act (EISA), which implemented a footprint-based vehicle scale and established a combined fleet average target of at least 35 mpg by 2020. The 2031 target was 50.4 mpg, but some regulatory tides have turned in ways eerily reminiscent of that 12% CAFE plunge. AdvertisementAdvertisementMeanwhile, preferred vehicle sizes continue to swell. In 1975, the EPA's reported weight difference between an average sedan and pickup was 46 pounds, or a small child. Pickups in 2024 averaged 1,700 pounds — an NFL offensive line — more than sedans. The juxtaposition of improved safety ratings with deadly vehicle sizes clearly matters, and the gas-powered SUV explosion has no doubt offset efficiency gains. With due credit to automotive engineers, EPA testing between 1975 and today has also become more stringent. The 1975 mpg figures were determined by a two-cycle, city/highway simulation, run in a lab on a dynamometer. To achieve more accurate real-world estimates, the five-cycle test was introduced in 2006. It includes those urban and highway cycles, plus formulas for aggressive driving, air conditioning, and cold temperature operation. That accounts for roughly a 30% variation in ratings, as shown by the EPA's example of a 2024 Toyota Prius achieving a combined 80 mpg on the 1970s two-cycle test, versus the 56 mpg, five-cycle value.Want more like this? Join the Jalopnik newsletter to get the latest auto news sent straight to your inbox, and follow us or add us as a preferred search source on Google.Read the original article on Jalopnik.



















 +39 others